Thursday, April 25, 2019

Manage and monitor SQL Server backups from a central location

Manage and monitor SQL Server backups from a central location

Introduction
Running and maintaining multiple SQL Server instances can often be a formidable challenge, especially if these instances run on multiple servers. It is easy enough to set up a SQL Server agent job for each server to automate the backups, but what happens if there are 20, 30, or 100 servers that need maintenance? In this scenario, configuring agents on each server would take forever, and monitoring the entire setup would prove to be a nightmare for any administrator. Of course, there are several solutions for this scenario:

  1. It is possible to configure Central Management Server, to define server groups, and to add one or more servers to these server groups. This way, T-SQL statements or Policy-Based Management policies could be executed on all registered servers from a Server Group at the same time. The main flaw of CMS setup is complex monitoring and limited automation. Furthermore, only Windows Authentication is allowed when using CMS setups.
  2. You could create multiserver environment. If using this solution, the Master server (MSX), and one or more Target servers have to be configured using SQL Server Agent. In this setup, jobs are initially defined on the master server. The defined jobs are then passed to, and executed on target servers automatically. The reports on the jobs that run on target servers are sent back to the master server, which makes the monitoring much easier.
  3. Use ApexSQL Backup. A simple-to-use software with all needed features in one place. ApexSQL Backup user interface, central repository database and Backup Agent Service are installed on the server that is used for backup management and monitoring. By connecting to other servers using ApexSQL Backup, application automatically installs Backup Agent Service on connected servers. All connected servers are displayed in application server list. Through this application, it is possible to manage and monitor backups with ease, all from a single machine.
Central Management Server and Server Groups
In order to configure this setup, you have to install Central Management Server (CMS) first. Mind that you will not be able to manage databases on this server itself by using central script execution or PBM policies. Therefore, the best practice is to use a machine that does not require database maintenance as a Central Management Server. The entire process consists of few basic steps: creating the CMS, defining new server groups, and registering new servers in these groups. Here are basic instructions for the setup using SSMS:
  1. Log in to a server that you want to use as a CMS
  2. Go to the View menu, and click Registered servers
  3. In Object explorer, connect to all servers that you want to include in this setup. Be sure to use Windows authentication for all of them.
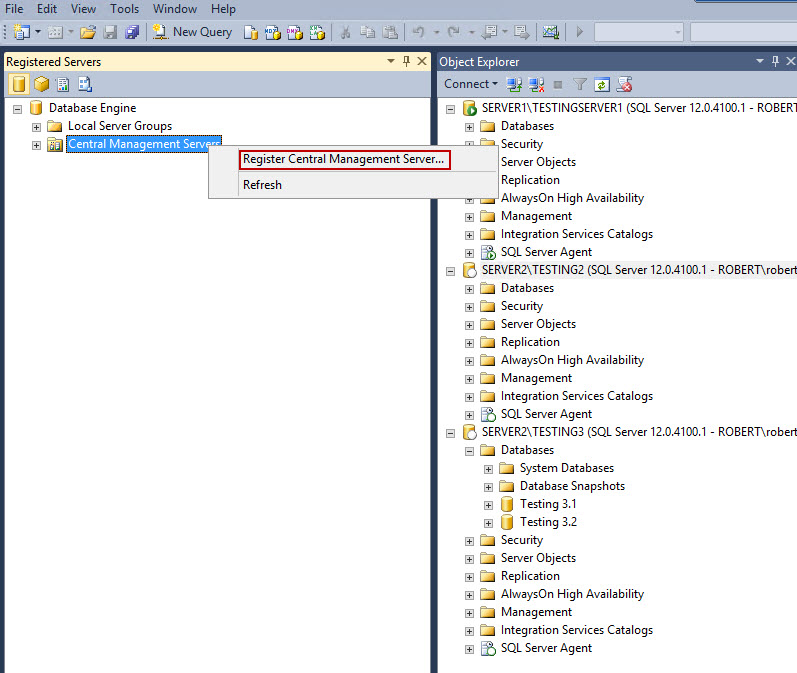
  4. Right click on Central Management Servers, select Register Central Management Server…
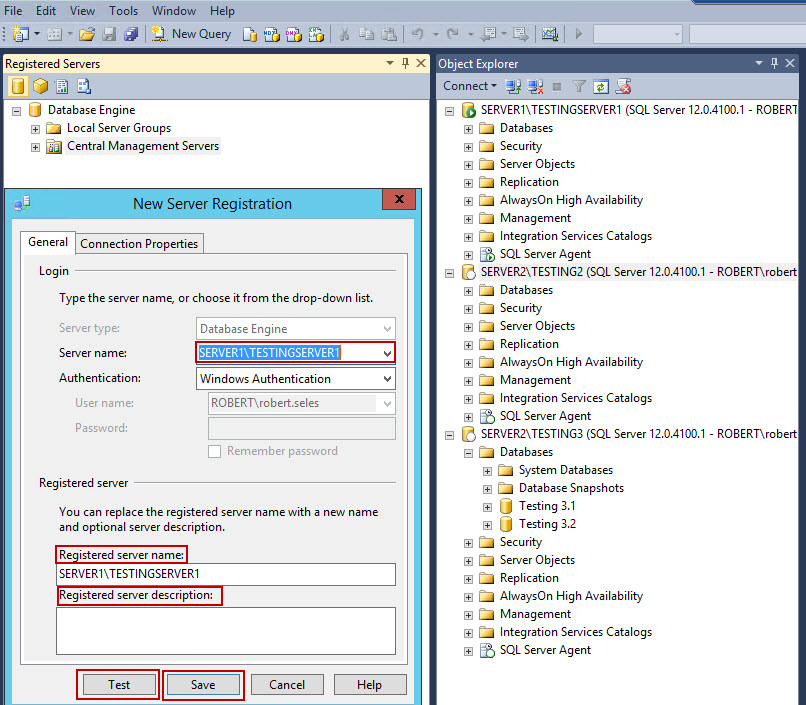
  5. In the Server name field, select the server that you want to use as a CMS from the dropdown menu. Optionally, you can replace the name of registered server, or add the description for it. Click on the Test button to make sure that the connection with the server runs properly. If you get the message “The connection was tested successfully”, click the Save button to complete the CMS registration.
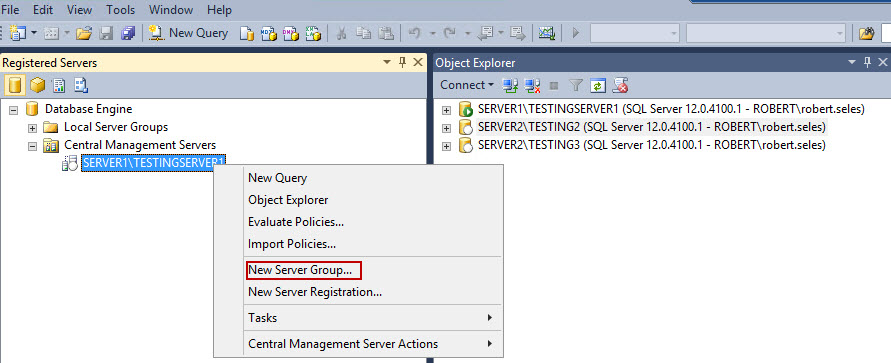
  6. To create the server groups, right click on your CMS. Select New Server Group…
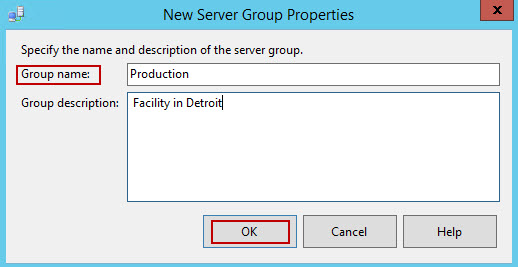
  7. Specify the Group name, and Group description (optionally)

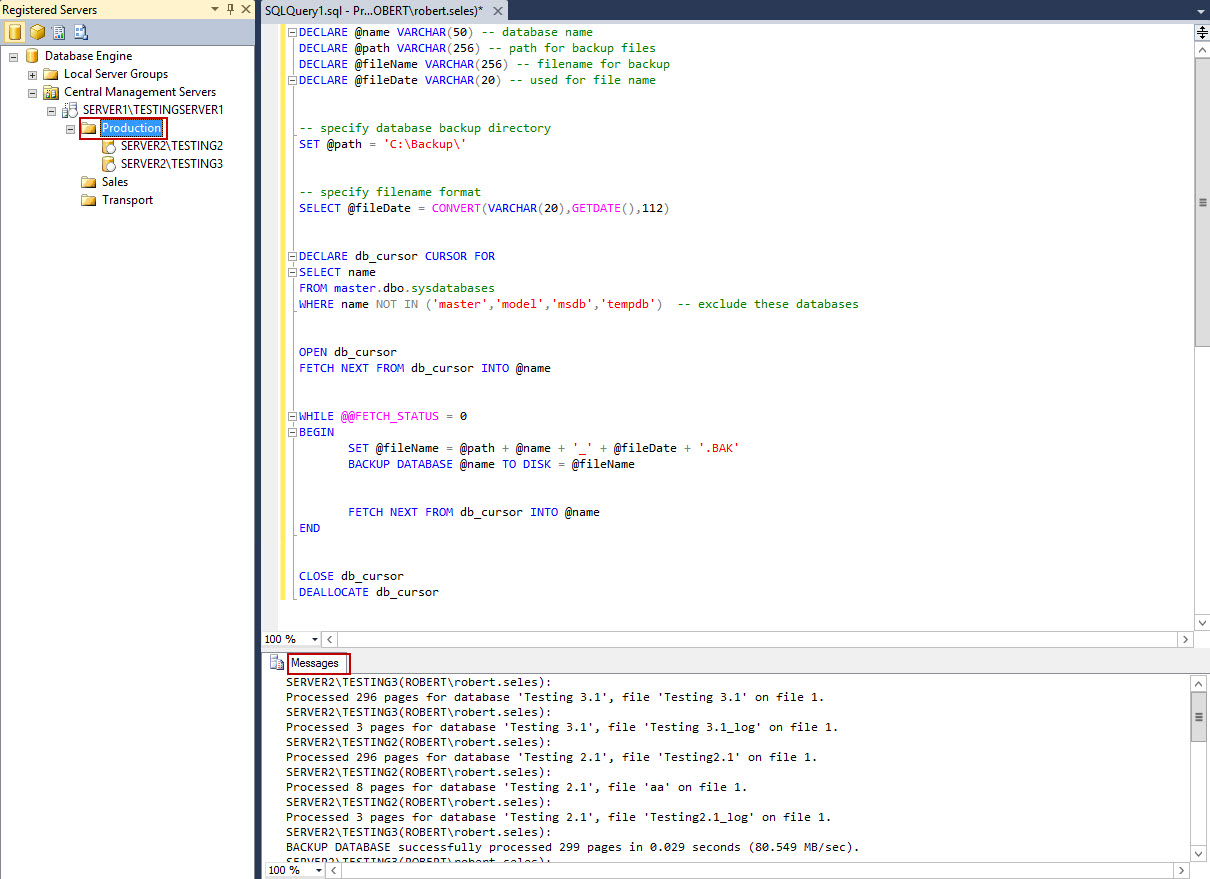
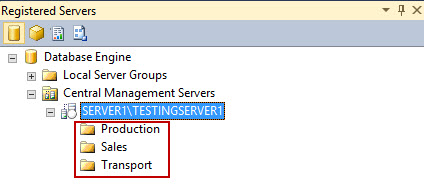
  8. By repeating steps 6 and 7, you can add as many groups as you need. IN this article, 3 groups are defined: Production, Sales and Transport

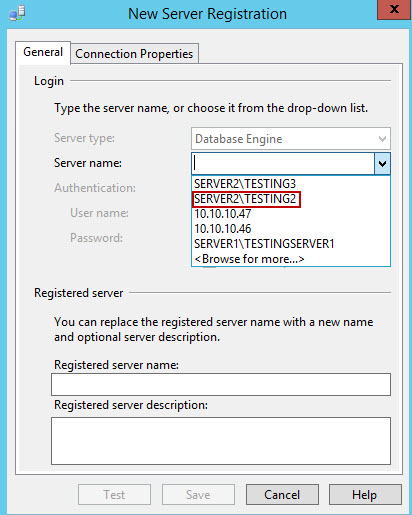
  9. To add new servers to defined server groups, right click on the server group, and select New server registration… From the dropdown menu in Server names, select one of the servers that you want to add to the group. Enter the registered server name and description if needed, Test the connection, and Save changes. By repeating this step, additional servers can be registered and sorted amongst server groups.

  10. All types of queries can be run against any of the defined server groups, including backup queries. By right clicking on a group, and selecting New query, you can define the query that runs against all servers in selected group. In the example, the Backup query is run against all servers in Production group. The results of the query are displayed in the lower screen, in Messages.
  11. Simple PBM policy can be used to monitor the status of backups. Create the policy that you want to evaluate, and run it against single, or all server groups.
Backups in a multiserver environment
To create multiserver environment, you need to assign the master server (MSX), and to add one or more target servers (TSX) to it.
  1. Connect to the server instance that you want to use as a master server
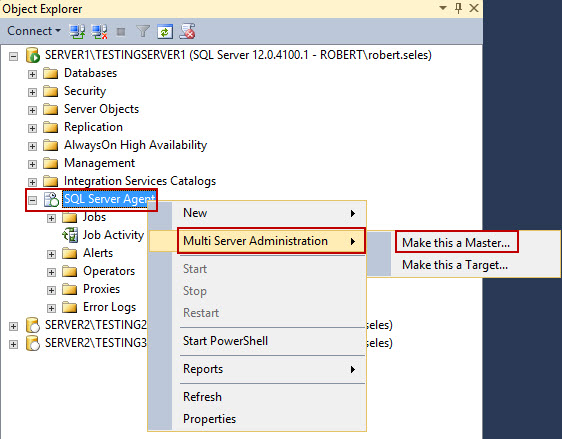
  2. Right click on SQL Server Agent, select Multi Server Administration, and Make this a Master.

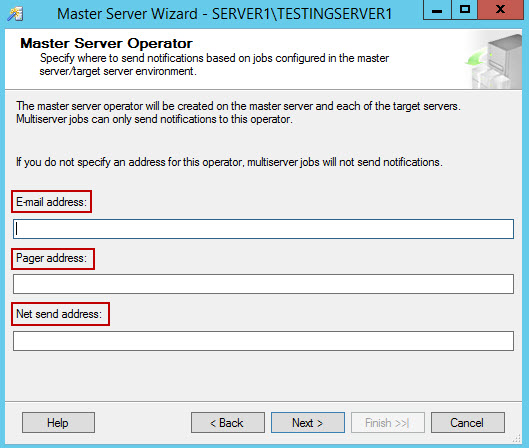
  3. The option will start Master server configuration wizard. In first step of the wizard, addresses for the notifications could be set: E-mail, Pager, or Net send address.

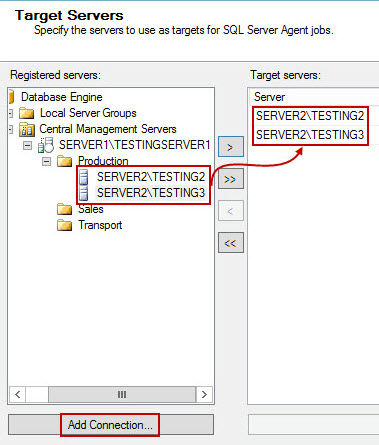
  4. Next step assigns the target servers. All registered servers are displayed on the left. Each of them can be used as a target server, simply by adding them to the list on the right window. If you want to add more target servers, that are not yet in the list, you can use Add connection button. Unlike CMS setup, multiserver environment allows SQL Server authentication when adding target servers to the list.

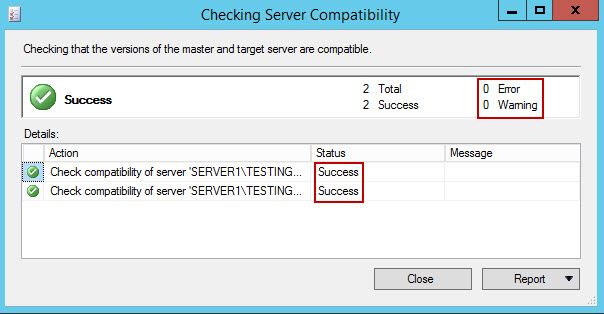
  5. After all servers are added, wizard checks the compatibility between master and target servers. If all processes complete successfully, click Close.

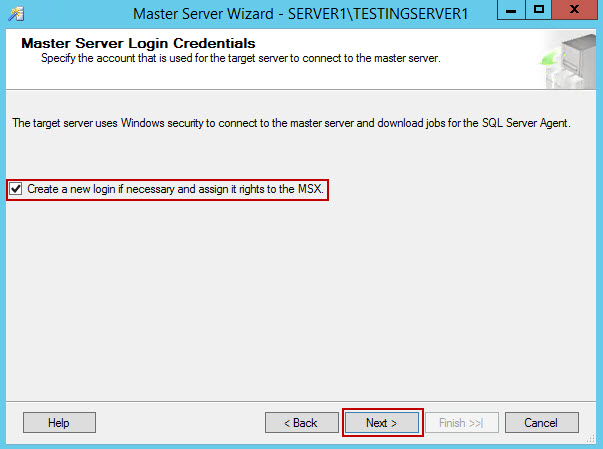
  6. Optionally you can specify new Login to use when connecting to target servers

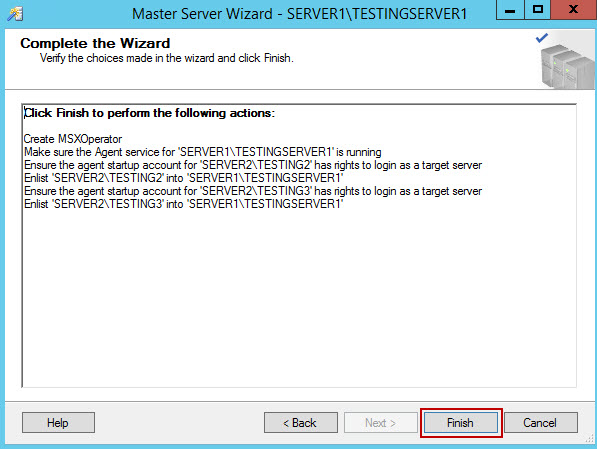
  7. In final step, the list of pending actions is displayed

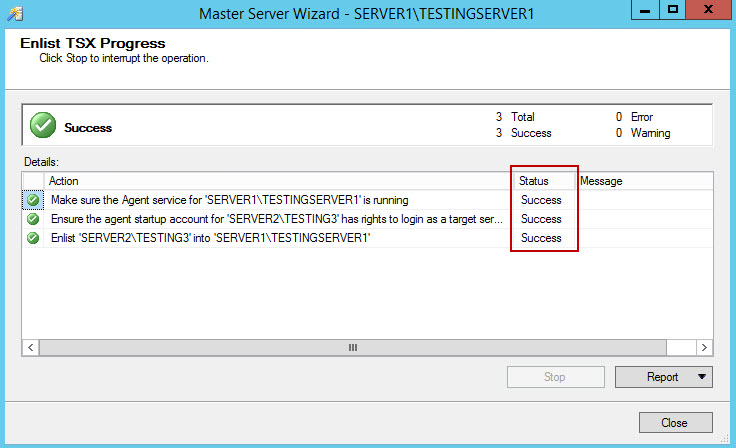
  8. The wizard runs the actions from previous step, and If all complete successfully, click close. Should you get an error, you might need to modify startup account for the target server(s), and grant it additional permission, or to make a new account. I also had to change the registry value for MsxencryptChannelOptions from 2 (default) to 0.
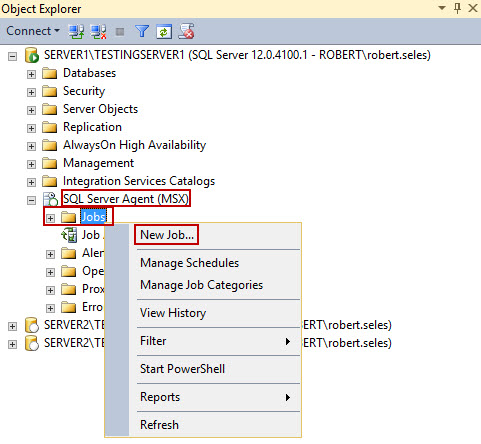
  9. After the multiserver environment setup completed successfully, we need to create backup jobs that will run on target servers. To create a new job, connect to the server that is used as MSX, expand SQL Server Agent (MSX), right click Jobs, and select New job.

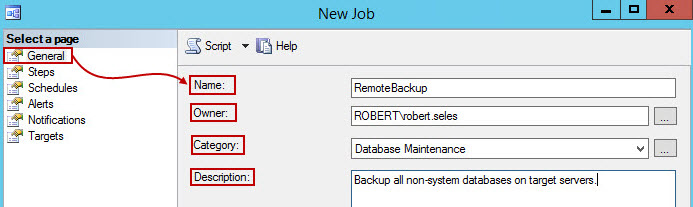
  10. In New Job window, General tab, the Name, Owner, Category, and Description for the job are specified.
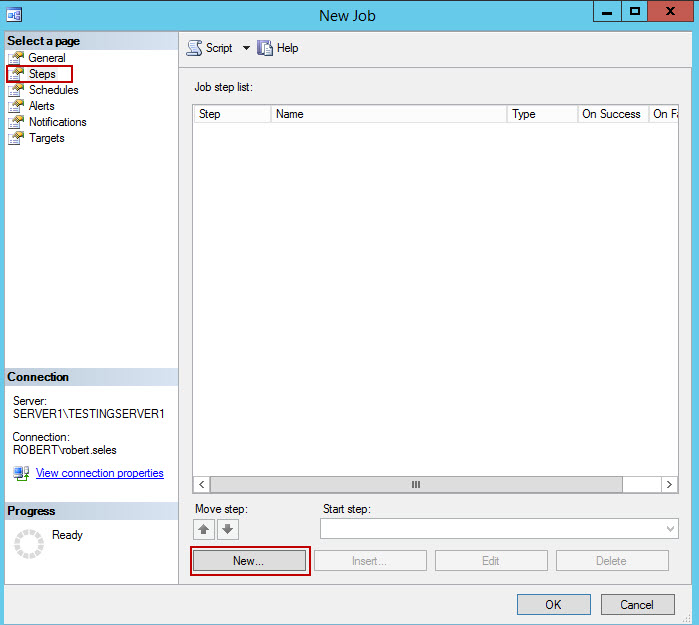
  11. In Steps tab every step of the procedure needs to be defined. To add the first step, click New.
  12. The Step name, Type, and Command need to be defined for the step. For this step, we are using the T-SQL script that backs up all non-system databases in C:\Backup\ folder. When done, click Ok. If additional steps are needed for the job, repeat this step until the job is configured according to your needs.
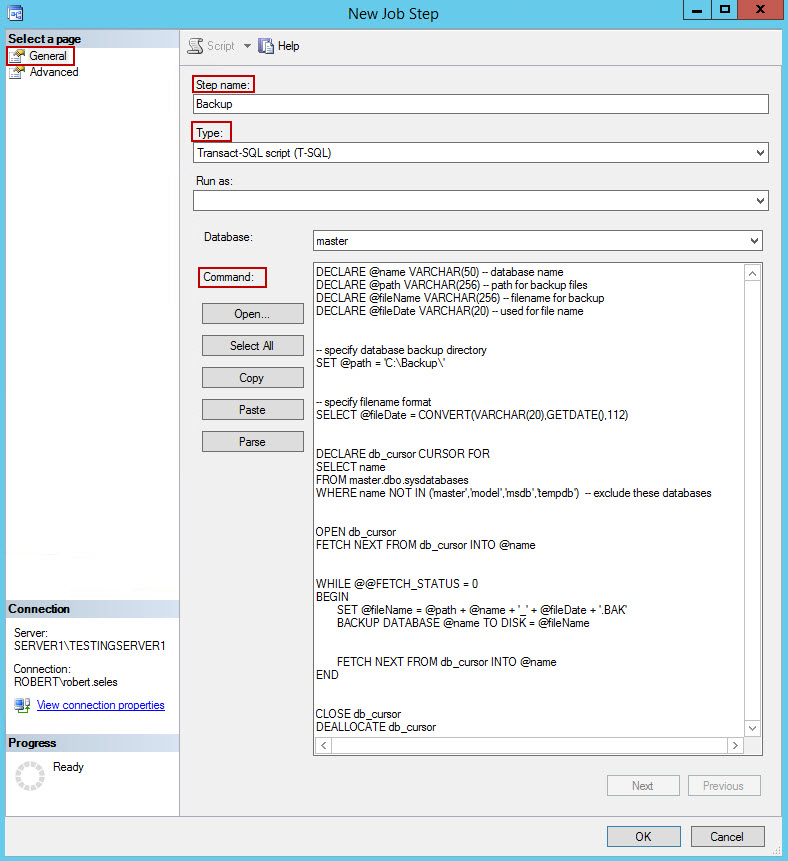
  13. Schedules, Alerts and Notifications could also be specified for the job
  14. Finally, in Targets tab, select the Target multiple servers radio button, and check the boxes in front of the servers that need to be backed up. Click Ok when done.
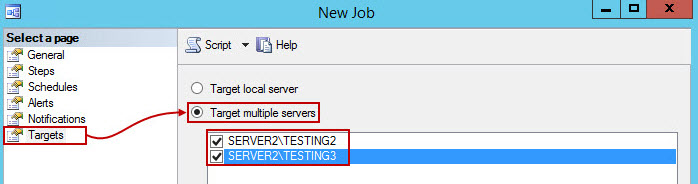
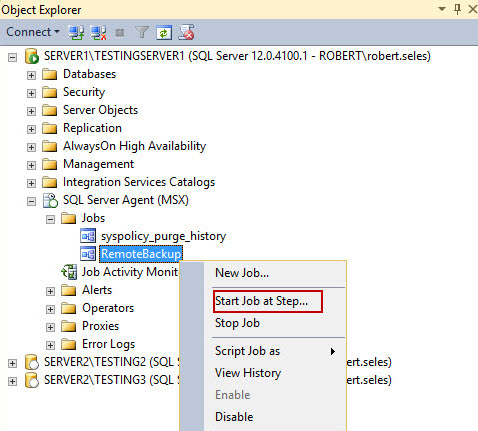
  15. To run the created job, expand SQL Server Agent (MSX), and Jobs. Right click on a job that needs to be done, and select Start Job at Step.

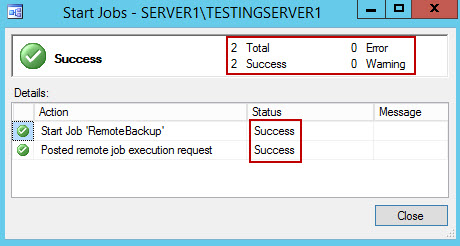
  16. If all is done properly, the job will execute all defined steps, and display the Success message
ApexSQL Backup
ApexSQL Backup is 3rd party software application, that can be used to manage multiple backups across any number of servers. It supports both Windows, and SQL Server authentication. The application consists of three main components: User interface, Central Repository Database and an agent service. The user interface is used to manipulate, schedule, and execute jobs; central repository database for storing information and configuration data; and agent service for communication between user interface, central repository database and SQL Server instances. To install ApexSQL Backup, perform the following steps:
  1. The installer could be downloaded here.
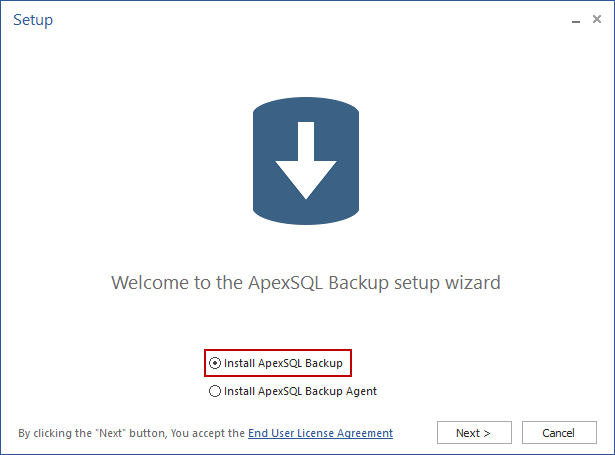
  2. Run the installer, select Install ApexSQL Backup, and click Next.

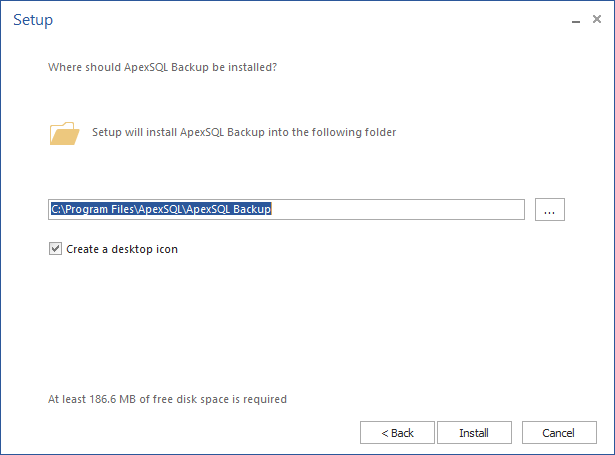
  3. Specify the installation path for ApexSQL Backup

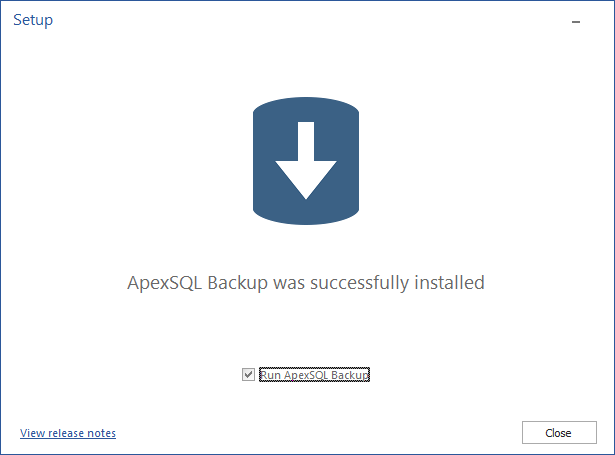
  4. Complete the setup by clicking on Close button.

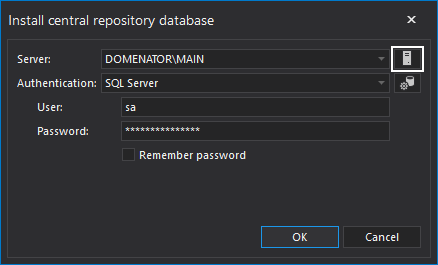
  5. Running ApexSQL Backup for the first time will automatically start the installation of central repository database. In this step, we can choose the server that will host the ApexSQL Backup central repository database. The ApexSQL Backup central repository database can be installed on either local, or network server. To obtain list of available servers, click on the Server button next to the SQL Server text box. The SQL Server instances will be visible in the list only if SQL Server Browser service runs on these servers.

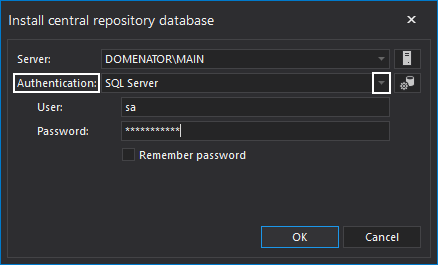
  6. You should also choose Login type for the server that will host the ApexSQL Backup central repository database. You could choose either Windows or SQL Server Authentication, depending on the Login that is used to administer this SQL Server. The Login that is used needs to have administrator privileges on the chosen server. It is also recommended to use SQL Server authentication, if you plan to manage multiple servers that do not belong to the same domain. Click Ok when done.

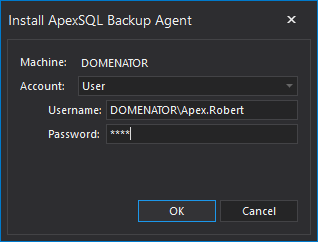
  7. As soon as central repository database is configured, the form for the agent service installation will start automatically. ApexSQL Backup agent service is a small service that is used for communication between the user interface, central repository database and SQL Server instances. Only one agent service is required, regardless of the number of managed instances. ApexSQL Backup agent service is installed on the same computer as the ApexSQL Backup application. To install the agent service, it is necessary to select Account type. If User account is selected, provide the full domain Username, and password for this account (this password is also used for logging in to Windows, when this user starts the operating system). Click OK and wait a few moments until the installation completes.

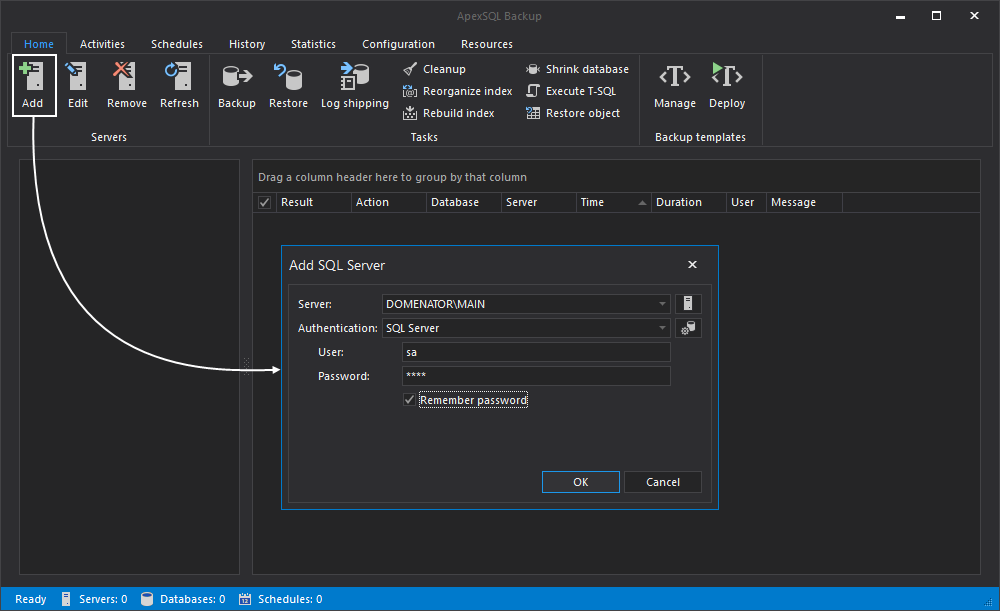
  8. To add servers that you want to manage with the application, click Add button in the Home tab. You can choose servers which you want to add and specify the Logins that you use to access these servers. Both local and remote server instances can be added this way. The Server field accepts server parameters both in the form of server name (DOMAIN\NAME) and the IP address of the server. To see the list of available servers, and pick one manually, click on the Server button next to the text box. Select the authentication type in Authentication box. The login that is used to access the server needs to have appropriate permissions to backup and restore databases on respective server. It is best to use SQL Server authentication for the servers that are outside of the current domain.

  9. To add multiple servers, just repeat the previous steps. All servers that are added, along with the databases located on these servers will appear in the server pane to the left.
After the setup is done, we can try to execute some basic operations using the application user interface.
  1. To perform backup operations, click the Backup button in the Home tab ribon

  2. This will start the Backup wizard. You can specify the SQL Server that will be used in the operation, exact databases that you want to backup, backup type, and backup componens. Main tab of the backup wizard also contains settings for the job naming and job description along with the settings for the file destination.
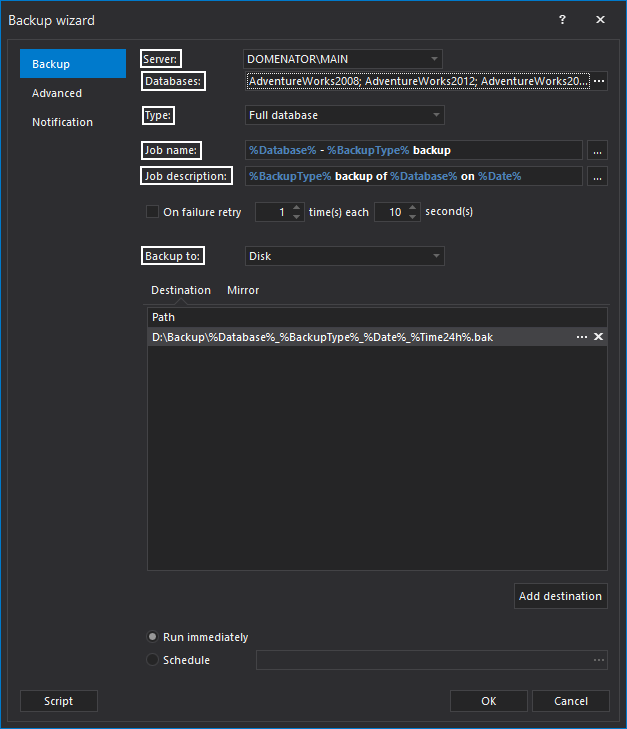
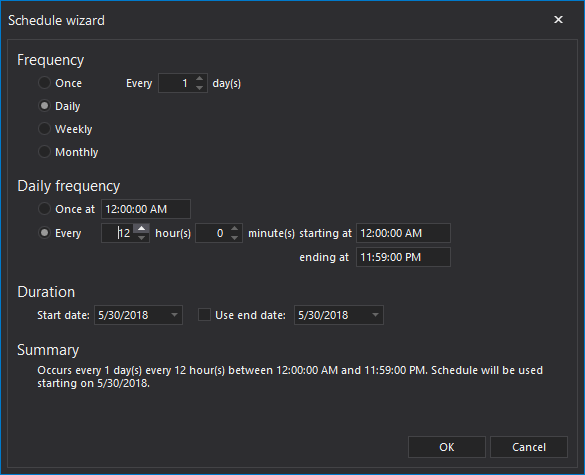
  3. If backup job needs to be run on a regular basis, click the Schedule radio button, and the Schedule wizard will appear automatically. Set the preferred frequency for the backup job in the Schedule wizard.
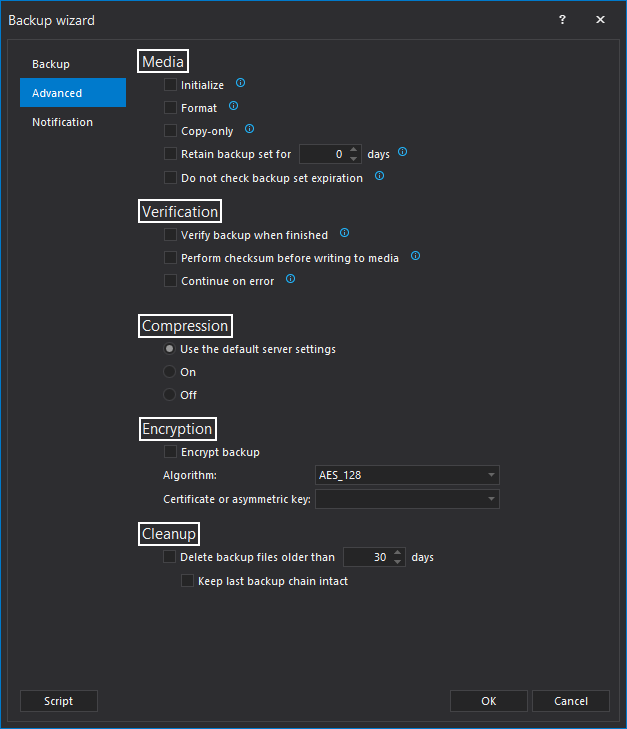
  4. In  Advanced tab, additional actions could be set for the backup job, like verification, compression, encryption, and cleanup of the old files.
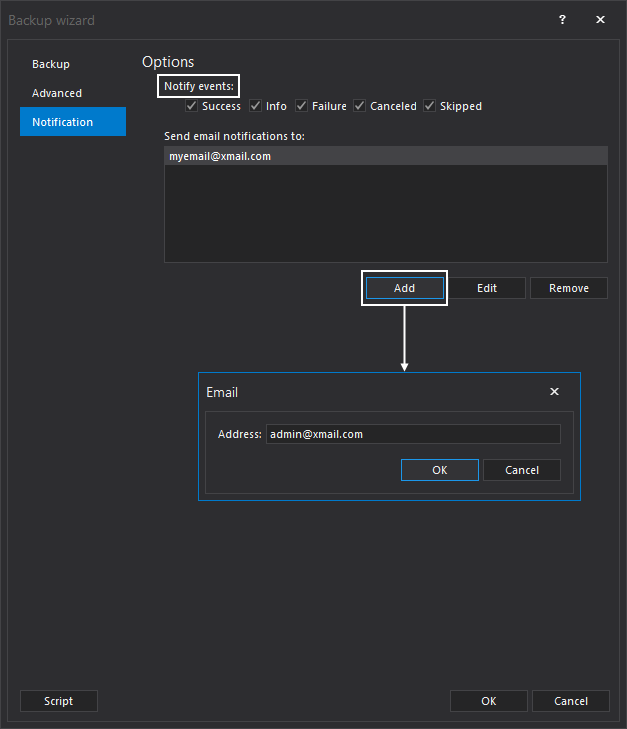
  5. If needed, set the Email notification settings in Notification tab. Cjeck the boxes in front of the job conditions that should trigger Email notification, and add one or more Email addresses as Email recipients. To complete job configuration, click on OK button at the bottom of the page.
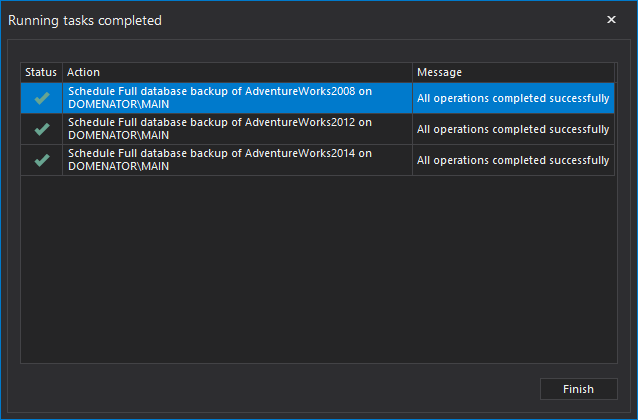
  6. In final step, all executed actions are listed. In this example, 3 database backups are scheduled.
There are several options implemented in the tool that are used for monitoring backups:
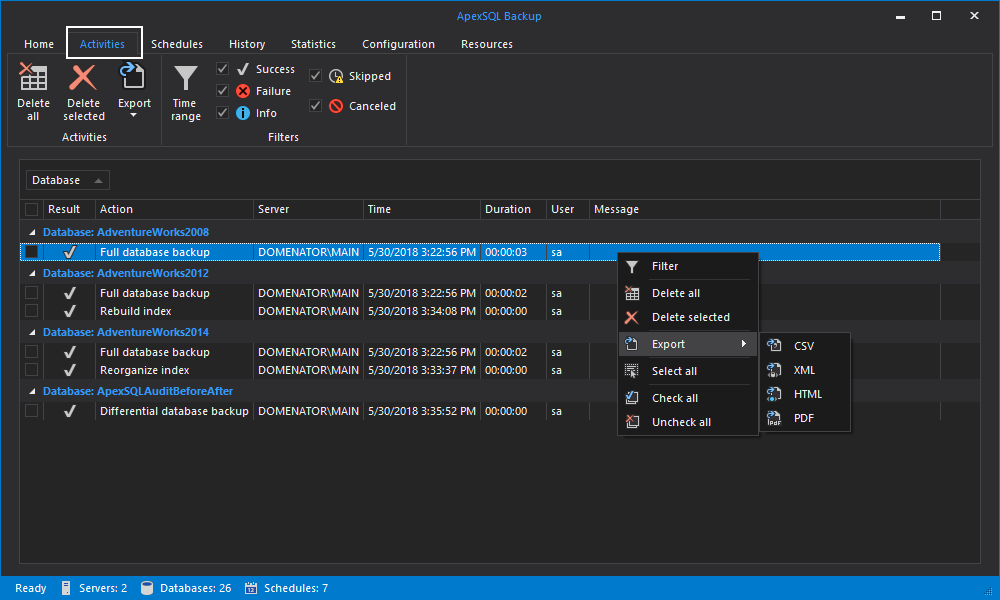
  1. You can track all performed backups in Activities tab. All activities regarding selected database, server, or complete server list are displayed in Activities grid.

  2. All schedules are displayed in Schedules tab. Schedules can be grouped by server, database, status, or any other column that is present in the grid. Each schedule can be edited, disabled, deleted or run on demand, either from the application ribbon, or from the context menu.
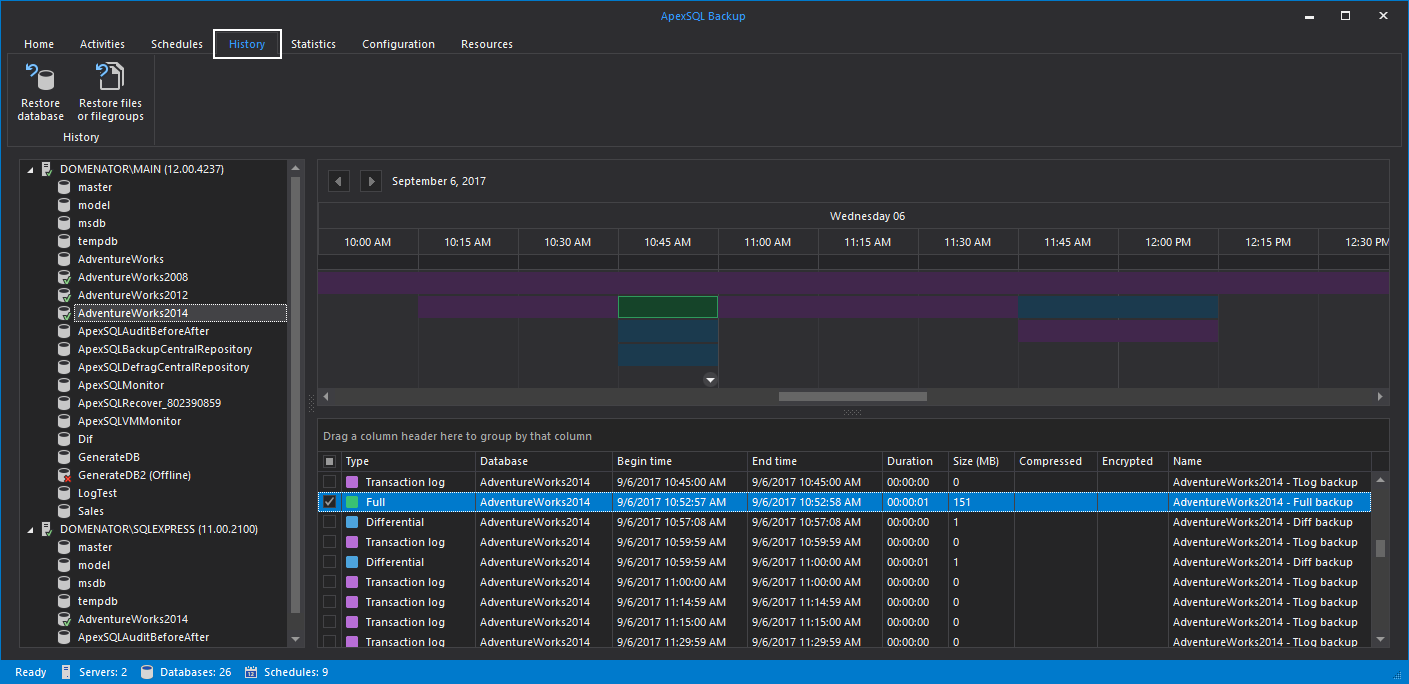
  3. History tab shows the details for all backups performed on the selected database.
Read a SQL Server transaction log

Read a SQL Server transaction log

SQL Server transaction logs contain records describing changes made to a database. They store enough information to recover the database to a specific point in time, to replay or undo a change. But, how to see what’s in them, find a specific transaction, see what has happened and revert the changes such as recovering accidentally deleted records

To see what is stored in an online transaction log, or a transaction log backup is not so simple
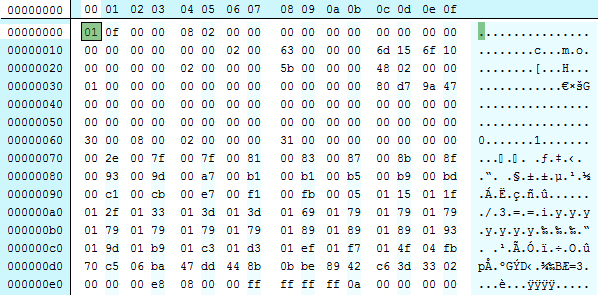
Opening LDF and TRN files in a binary editor shows unintelligible records so these clearly cannot be read directly. For instance, this in an excerpt from an LDF file:

Opening LDF and TRN files in a binary editor

Use fn_dblog

fn_dblog is an undocumented SQL Server function that reads the active portion of an online transaction log
Let’s look at the steps you have to take and the way the results are presented
  1. Run the fn_dblog function
  2. Select * FROM sys.fn_dblog(NULL,NULL)
    Results set returned by fn_dblog function
    As the function itself returns 129 columns, returning only the specific ones is recommended as well as narrowing down the results to a specific transaction type, if applicable
  3. From the results set returned by fn_dblog, find the transactions you want to see
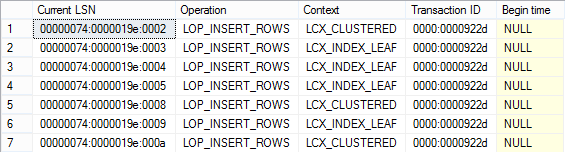
  4. To see transactions for inserted rows, run:
    SELECT [Current LSN], 
           Operation, 
           Context, 
           [Transaction ID], 
           [Begin time]
           FROM sys.fn_dblog
       (NULL, NULL)
      WHERE operation IN
       ('LOP_INSERT_ROWS');

    Transactions for inserted rows

    To see transactions for deleted records, run:
    SELECT [begin time], 
           [rowlog contents 1], 
           [Transaction Name], 
           Operation
      FROM sys.fn_dblog
       (NULL, NULL)
      WHERE operation IN
       ('LOP_DELETE_ROWS');
    Transactions for deleted rows
  5. Find the column that stores the value inserted or deleted – check out the RowLog Contents 0 , RowLog Contents 1 , RowLog Contents 2 , RowLog Contents 3 , RowLog Contents 4, Description and Log Record
  6. Row data is stored in different columns for different operation types. To be able to see exactly what you need using the fn_dblog function, you have to know the column content for each transaction type. As there’s no official documentation for this function, this is not so easy
    The inserted and deleted rows are displayed in hexadecimal values. To be able to break them into fields you have to know the format that is used, understand the status bits, know the total number of columns and so on
  7. Convert binary data into table data taking into account the table column data type. Note that mechanisms for conversion are different for different data types
fn_dbLog is a great, powerful, and free function but it does have a few limitations – reading log records for object structure changes is complex as it usually involves reconstructing the state of several system tables, only the active portion of an online transaction log is read, and there’s no UPDATE/BLOB reconstruction
As the UPDATE operation is minimally logged in transaction logs, with no old or new values, just what was changed for the record (e.g. SQL Server may log that “G” was changed to “F”, when actually the value “GLOAT” was changed into ”FLOAT”), you have to manually reconstruct the state prior to the update which involves reconstructing all the intermediary states between row’s original insertion into page and the update you are trying to reconstruct
When deleting BLOBs, the deleted BLOB is not inserted into a transaction log, so just reading the log record for the DELETE BLOB cannot bring the BLOB back. Only if there is an INSERT log record for the deleted BLOB, and you manage to pair these two, you will be able to recover a deleted BLOB from a transaction log using fn_dblog

Use fn_dump_dblog

To read transaction log native or natively compressed backups, even without the online database, use the fn_dump_dblog function. Again, this function is undocumented
  1. Run the fn_dump_dblog function on a specific transaction log backup. Note that you have to specify all 63 parameters
  2. SELECT *
    FROM fn_dump_dblog
    (NULL,NULL,N'DISK',1,N'E:\ApexSQL\backups\AdventureWorks2012_05222013.trn', 
    DEFAULT,DEFAULT,DEFAULT,DEFAULT,DEFAULT,DEFAULT,DEFAULT,DEFAULT,DEFAULT, 
    DEFAULT,DEFAULT,DEFAULT,DEFAULT,DEFAULT,DEFAULT,DEFAULT,DEFAULT,DEFAULT,
    DEFAULT,DEFAULT,DEFAULT,DEFAULT,DEFAULT,DEFAULT,DEFAULT,DEFAULT,DEFAULT,
    DEFAULT,DEFAULT,DEFAULT,DEFAULT,DEFAULT,DEFAULT,DEFAULT,DEFAULT,DEFAULT,
    DEFAULT,DEFAULT,DEFAULT,DEFAULT,DEFAULT,DEFAULT,DEFAULT,DEFAULT,DEFAULT,
    DEFAULT,DEFAULT,DEFAULT,DEFAULT,DEFAULT,DEFAULT,DEFAULT,DEFAULT,DEFAULT,
    DEFAULT,DEFAULT,DEFAULT,DEFAULT,DEFAULT,DEFAULT,DEFAULT,DEFAULT, 
    DEFAULT);
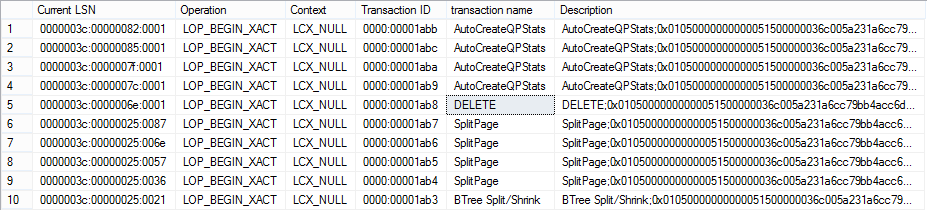
    fn_dump_dblog function output
    The same as with fn_dbLog, 129 columns are returned, so returning only the specific ones is recommended
    SELECT [Current LSN], 
           Operation, 
           Context, 
           [Transaction ID], 
         [transaction name],
           Description
    FROM fn_dump_dblog
    (NULL,NULL,N'DISK',1,N'E:\ApexSQL\backups\AdventureWorks2012_05222013.trn', 
    DEFAULT,DEFAULT,DEFAULT,DEFAULT,DEFAULT,DEFAULT,DEFAULT,DEFAULT,DEFAULT, 
    DEFAULT,DEFAULT,DEFAULT,DEFAULT,DEFAULT,DEFAULT,DEFAULT,DEFAULT,DEFAULT,
    DEFAULT,DEFAULT,DEFAULT,DEFAULT,DEFAULT,DEFAULT,DEFAULT,DEFAULT,DEFAULT,
    DEFAULT,DEFAULT,DEFAULT,DEFAULT,DEFAULT,DEFAULT,DEFAULT,DEFAULT,DEFAULT,
    DEFAULT,DEFAULT,DEFAULT,DEFAULT,DEFAULT,DEFAULT,DEFAULT,DEFAULT,DEFAULT,
    DEFAULT,DEFAULT,DEFAULT,DEFAULT,DEFAULT,DEFAULT,DEFAULT,DEFAULT,DEFAULT,
    DEFAULT,DEFAULT,DEFAULT,DEFAULT,DEFAULT,DEFAULT,DEFAULT,DEFAULT, 
    DEFAULT);
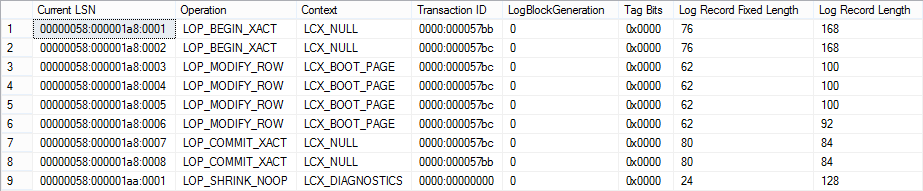
    Again, you have to decipher hex values to get the information you’re looking for
    Returning specific columns using fn_dump_dblog function
    And you are back to square one as with using fn_dblog – you need to reconstruct all row values manually, you need to reconstruct entire state chains for UPDATE operations and BLOB values and so on
    If you don’t want to actually extract transactions from the transaction log backup, but to restore the database to a point in time before a specific operation occurred, you can:
  3. Determine the LSN for this transaction
  4. Convert the LSN into the format used in the WITH STOPBEFOREMARK = ‘<mark_name>’ clause, e.g 00000070:00000011:0001 should be transformed into 112000000001700001
  5. Restore the full log backup chain until you reach the time when the transactions occurred. Use the WITH STOPBEFOREMARK = ‘<mark_name>’ clause to specify the referencing transaction LSN
    RESTORE LOG AdventureWorks2012
    FROM
        DISK = N'E:\ApexSQL\backups\AW2012_05232013.trn'
    WITH
        STOPBEFOREMARK = 'lsn:112000000001700001',
        NORECOVERY;

USE DBCC PAGE

Another useful, but again undocumented command is DBCC PAGE. Use it to read the content of database online files – MDF and LDF. The syntax is:
DBCC PAGE ( {'dbname' | dbid}, filenum, pagenum [, printopt={0|1|2|3} ])
To dump the first page in the AdventureWorks2012 database online transaction log file, use:
SELECT FILE_ID ('AdventureWorks2012_Log') AS 'File ID' 
-- to determine Log file ID = 2
DBCC PAGE (AdventureWorks2012, 2, 0, 2)
You’ll get
DBCC execution completed. If DBCC printed error messages, 
contact your system administrator.
By default, the output is not displayed. If you want an output in SQL Server Management Studio, turn on the trace flag 3604 first
DBCC TRACEON (3604, -1)
And then re-run
DBCC PAGE (AdventureWorks2012, 2, 0, 2)
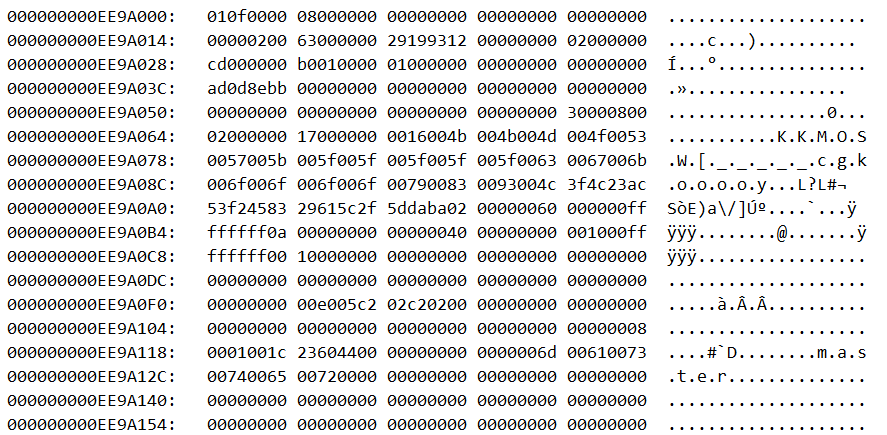
You’ll get a bunch of errors and bad header and you can ignore all that. At the end you’ll get a glorious hexadecimal output from the online LDF file:
Hexadecimal output from the online LDF file
Which is not the friendliest presentation of your database data and is basically no different than viewing it in a hex editor (just more uncomfortable) though at least you get access to the online data

Use ApexSQL Log

ApexSQL Log is a sql server transaction log reader which reads online transaction logs, detached transaction logs and transaction log backups – both native and natively compressed. When needed, it will also read database backups to get enough data for a successful reconstruction. It can replay data and object changes that have affected a database, including those that had occurred before it was installed. Unlike the undocumented and unsupported functions described above, you’ll get perfectly understandable information about what happened, on which object, and what the old and the new value were
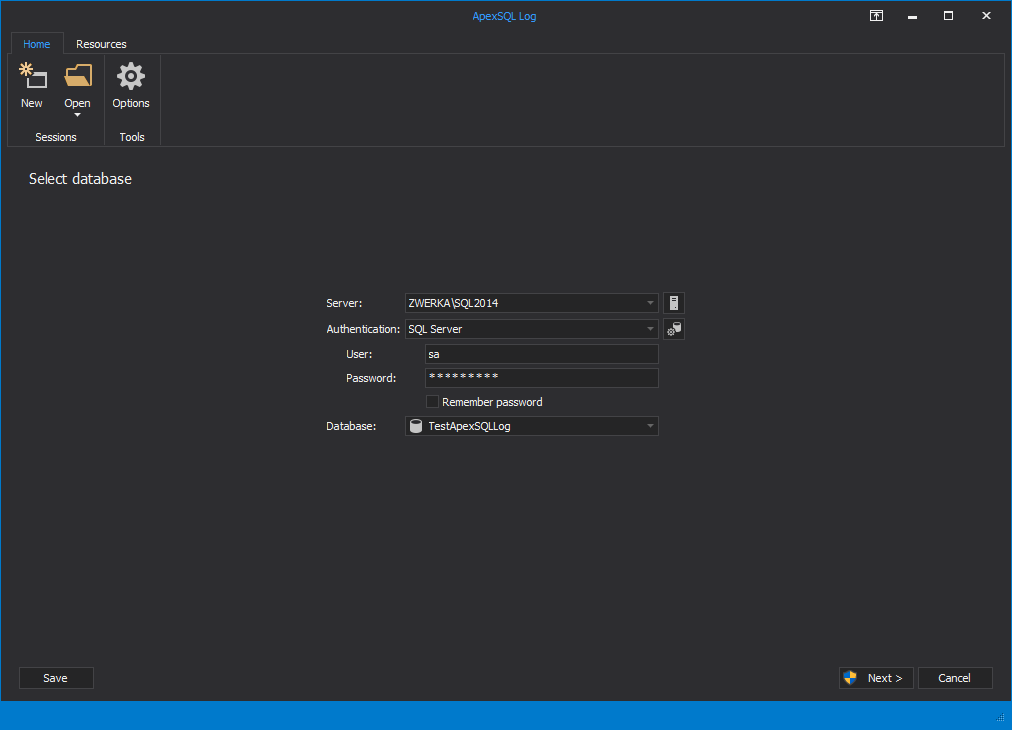
  1. Start ApexSQL Log
  2. Connect to the database for which you want to read the transaction logs
    Connecting to the database to read the transaction logs from
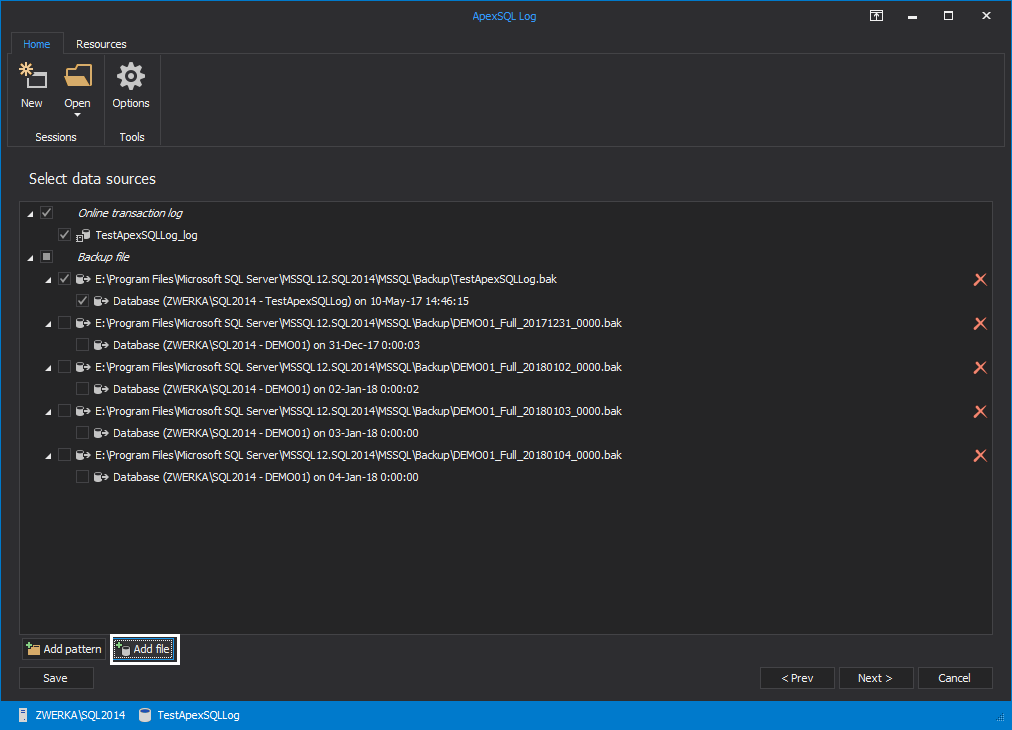
  3. In the Select data sources step, select the logs you want to read. Make sure they form a full chain. To add transaction log backups and detached LDF files, use the Add button
    Selecting the transaction logs to read from
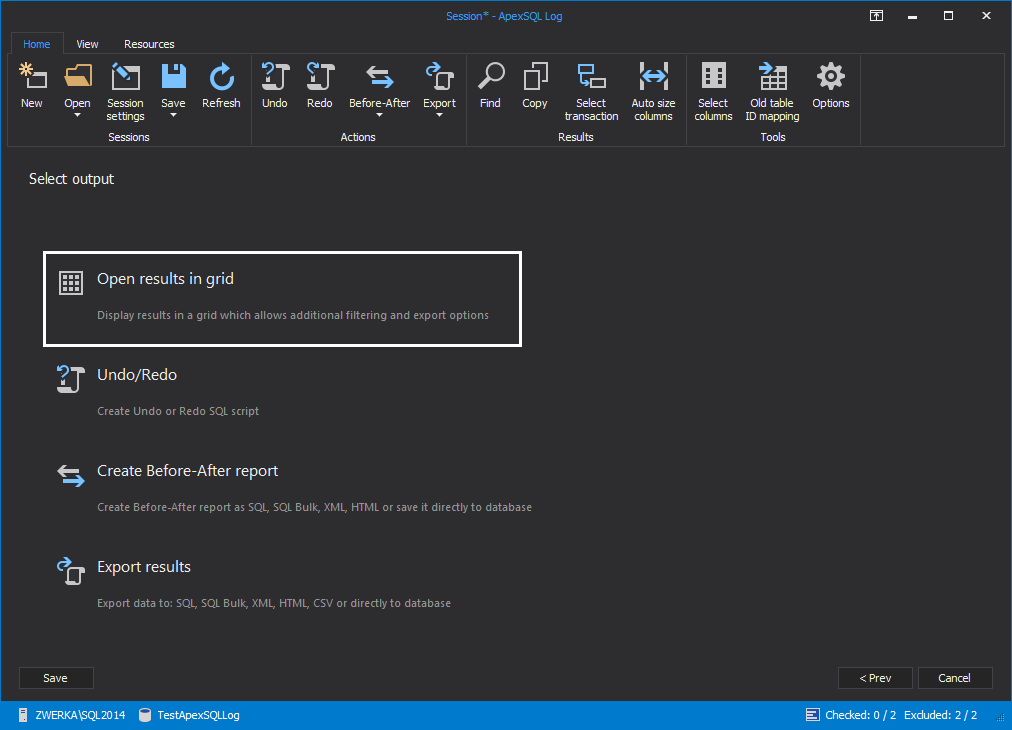
  4. In the next step, chose the output type – for the analysis purposes, select Open results in grid – this will load the audited data in the grid which is preferable output for investigation and analysis tasks.

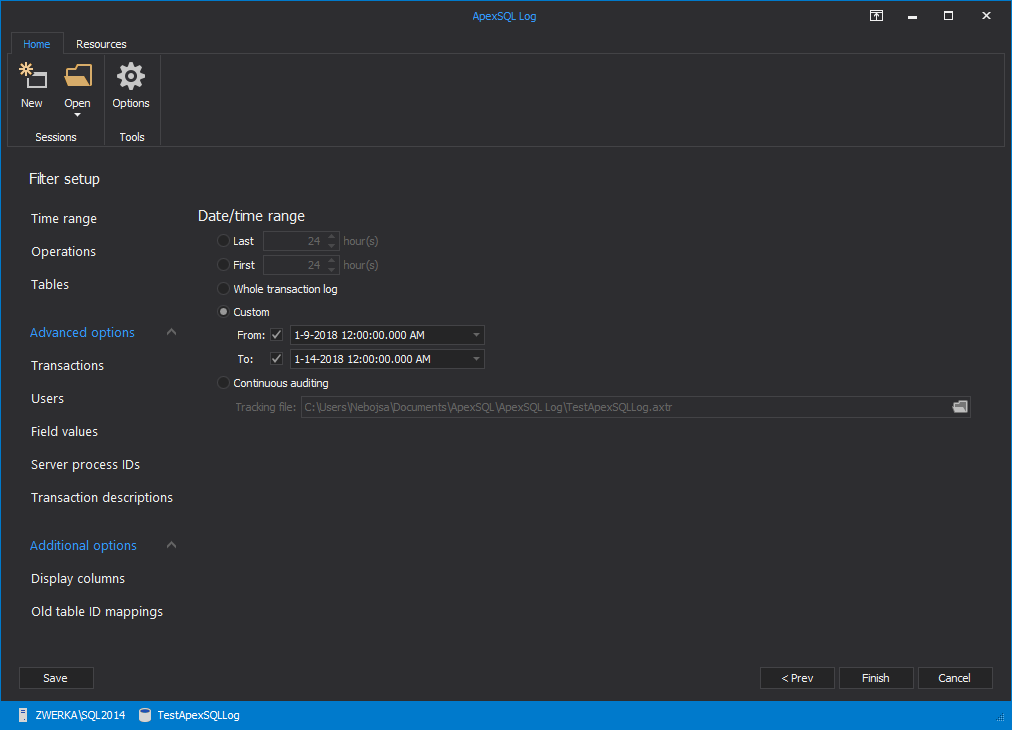
  5. Next, use the Filter setup options to narrow down the transactions read using the time range, operation type, table and other available filters
    Filtering the transactions read
  6. Click Finish
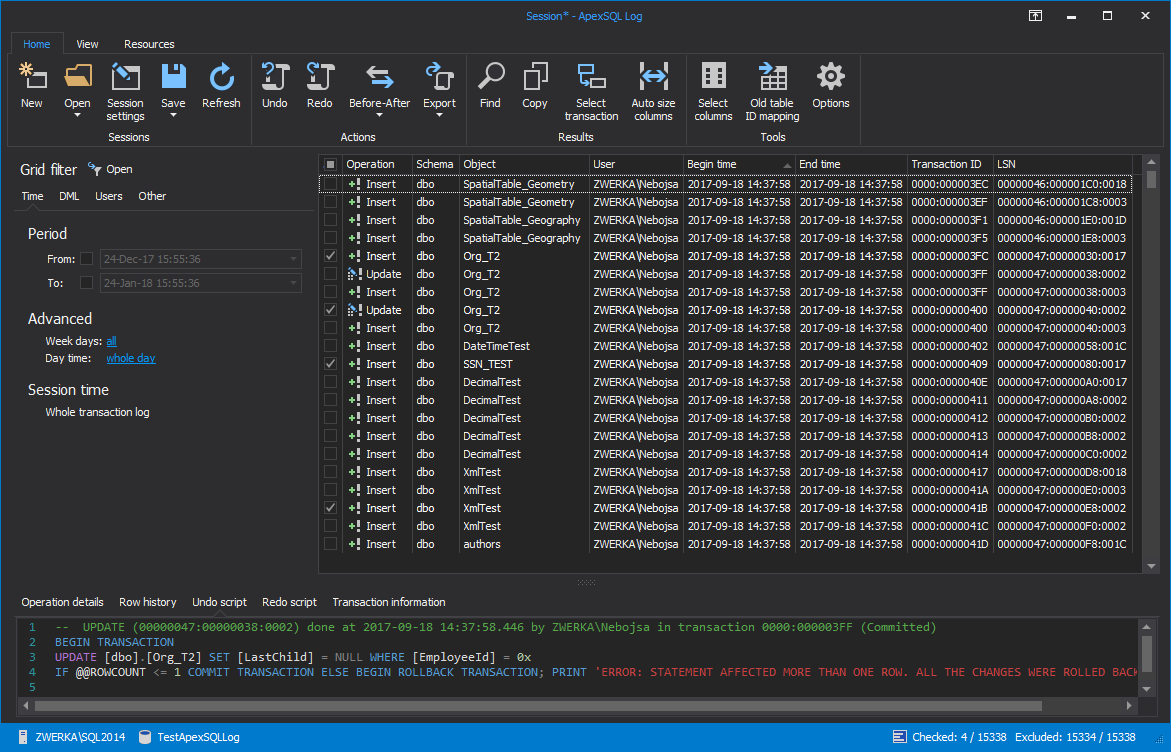
    Fully comprehensive results will be shown in the ApexSQL Log grid
    You will be able to see the time the operation began and ended, the operation type, the schema and object name of the object affected, the name of the user who executed the operation, the computer and application used to execute the operation. For UPDATEs, you’ll see the old and the new value of the updated fields
    Fully comprehensive results shown in the ApexSQL Log grid
To avoid hex values, undocumented functions, unclear column content, long queries, complex action steps, incomplete UPDATE and BLOB reconstruction when reading SQL Server transaction logs, use ApexSQL Log. It will read transaction logs for you and present the results “in plain English”. Besides that, undo and redo scripts are just a click away

Downloads

Please download the script(s) associated with this article on our GitHub repository.
Please contact us for any problems or questions with the scripts.

Monday, April 22, 2019

Useful SQL Server Commands

Useful SQL Server Commands

Commands For Display Information
  • Reports information about a specified database or all databases
    use : sp_helpdb
  • Reports information about the indexes on a table or view
    use : sp_helpindex
  • Returns statistics information about columns and indexes on the specified table
    use : sp_helpstats
  • Displays the definition of a user-defined rule, default, unencrypted Transact-SQL stored procedure, user-defined Transact-SQL function, trigger, computed column, CHECK constraint, view, or system object such as a system stored procedure
    use : sp_helptext
  • Reports information about a database object
    use : sp_help
  • Returns the physical names and attributes of files associated with the current database. use : sp_helpfile
  • Returns a list of objects that can be queried in the current environment. This means any object that can appear in a FROM clause
    use : sp_tables
  • Returns column information for the specified tables or views that can be queried in the current environment
    use : sp_columns
  • Reports information about locks
    use : sp_lock
  • Displays the number of rows, disk space reserved, and disk space used by a table
    use : sp_spaceused
  • Displays or changes global configuration settings for the current server
    use : sp_configure
  • Provides information about current users and processes
    use : sp_who or sp_who2 (undocumented on BOL Rolling Eyes)
  • Displays the current distribution statistics for the specified target on the specified table
    use : DBCC SHOW_STATISTICS
  • Displays fragmentation information for the data and indexes of the specified table
    use : DBCC SHOWCONTIG
  • Provides statistics about how the transaction-log space was used in all databases
    use : DBCC SQLPERF
  • Displays the last statement sent from a client
    use : DBCC INPUTBUFFER
Commands For Database And Server Maintenance
  • Rebuilds one or more indexes for a table in the specified database
    use : DBCC DBREINDEX
  • Defragments indexes of the specified table or view
    use : DBCC INDEXDEFRAG
  • Runs UPDATE STATISTICS against all user-defined and internal tables in the current database
    use : sp_updatestats
  • Creates single-column statistics for all eligible columns for all user tables and internal tables in the current database. The new statistic has the same name as the column where it is created.
    use : sp_createstats
  • Shrinks the size of the data files in the specified database
    use : DBCC SHRINKDATABASE
  • Shrinks the size of the specified data file or log file for the related database
    use : DBCC SHRINKFILE
  • Closes the current error log file and cycles the error log extension numbers just like a server restart. The new error log contains version and copyright information and a line indicating that the new log has been created
    use : sp_cycle_errorlog or DBCC ERRORLOG

Monday, April 15, 2019

Step-by-Step Data Warehousing

Step-by-Step Data Warehousing

In the February issue of SQL Server Magazine, we introduced the "7 Steps to Data Warehousing." In this follow-up article, we’ll demonstrate more in-depth data warehousing practices by focusing on a single business process, training. Keep in mind that we can add other processes to the data warehouse. The first step is to verify that data to describe this process is available. Then we’ll choose the key performance indicators that characterize the process, and perform dimensional analysis to generate the star schema. In future articles, we’ll populate the star schema tables, create cubes from the star schema, and use front-end tools to analyze it.
The company in this example has many lines of business, including development, staffing, consulting, and training, which contain some overlapping customer bases. Although the processes for these business activities are very different, they share many common dimensional entities. The same employees who consult often train. Clients who purchase
development also use staffing services, too. To keep the system manageable, each star schema structure should focus on a single business subject (e.g., training sales, development hours, consultant utilization, etc.). This method will result in many individual star schemas. The data from multiple stars can be merged, however, as long as they share common dimension tables. Thus, if there is one common dimension for customers, we can merge data about their training, development and consulting activities, drawn from distinct star schema structures. This requires some careful planning up front, but the end result quickly justifies the investment.

The training line of business provides an outstanding example of how to implement data-warehousing and decision-support systems. The training market has seen rapid and substantial change over the past few years, and the regional market for training across several other product lines has expanded significantly. Therefore, the data warehouse must let the training managers quickly identify trends and assess their impact and longevity. It must provide a basis for modifying existing business practices and creating new ones. And, the data warehouse needs to make relevant data as accessible as possible to answer future questions that we couldn’t predict during the design phase.

Step 1: Define the Processes

The processes in the training line of business are marketing, sales, class scheduling, student registration, attendance, instructor evaluation, billing, etc. To choose a manageable subset of these processes, we conducted interviews with the managers. From the interviews, we found that the most crucial information fell into four main areas: student demographics, payments, the reasons students chose this company, and the correlation between ratings on instructor evaluations and repeat registrations. To answer the questions about these defining processes, we captured data from the student registration, attendance, instructor evaluation, and billing processes that the company had previously collected. For later phases of the project, we collected information from other processes to answer questions about subjects such as profitability. Because the company shares resources among different lines of business, determining the resource’s cost component to be assigned to training requires integration with the parts of the data warehouse that will be developed for the other lines of business. Also, note that assigning such costs will be complex and prone to error if you do it in multiple phases. The cost components must be mutually exclusive and collectively exhaustive, otherwise profitability calculations will be meaningless.

Step 2: Define the Data Sources

The student table, mename, contains complete information about each student, including name, address, and company. The class table, meclas, contains information about each occurrence of a class, including the location, the start and end dates, how many seats were originally available, how many seats were occupied, and which instructor taught the class. The registration table, meregis, acts as a resolver table between the student table and the class table and contains additional information about each time a student attended a class. Figure 1 shows a diagram of the three student registration tables.

Step 3: Define the Dimensions

Now that we have a picture of the object to model, based on the questions we were tasked to answer and the tables we’ll extract the data from, we must refine this picture. Because the company sells training in the form of classes, we must clearly describe what a class is. Let’s use the term course to describe a particular curriculum, such as the System Administration for Microsoft SQL Server 7.0 course. The term class describes a specific event: a group of students and an instructor in a room on a specific day covering specific material. You identify the entities that work together to create the key performance indicators (KPI). For example, if the KPIs are gross revenue and expenses, the dimensions that generate that fact might be the student, the instructor, the course, the location, and the date. Each of these entities is represented as a dimension table.

Step 4: Define the Grain

The Student dimension requires a bit more thought because it’s possible to aggregate information about students to the company level. You could simply record information about how many students from a particular company attended a particular class and how much the company paid for it. This way of recording information would certainly save disk space; however, it would also make answers to certain questions obscure. For example, the managers want to know if students continue to attend the courses when they leave one company and go to another. So to reveal this information, the grain for Students is set to the individual student.
The Instructor and Location dimensions both have a small number of distinct values called members of the dimension. We are looking at revenue for the class, so the instructor might not necessarily be a dimension. Instructors train the students after the students have paid for instruction; instructors don’t directly contribute to revenue generation. But instructors do influence repeat students. Inserting the instructor as a dimension and linking him or her to revenue on repeat sales might be a method to evaluate instructor performance. The company has two primary locations, each with several classrooms. Also, many classes take place in other locations. It’s possible to set the grain for Location to the individual room the class is held in. However, the location information would be irrelevant (and often unavailable) for any site other than the two primary locations. Because the company didn't ask us to retrieve this information, we set the grain of the Location dimension to the building in which they held the class.
The class starting date and ending date will be stored in two dimensions. It’s possible to have a single time dimension and record a fact for each day of a class; however, the dimension doesn’t store the distinct information on a regular basis for each class day. Because the individual days of the class don’t directly affect the facts (e.g., I don’t earn less or more on the second or third day), there is no need to increase the size of the structure with redundant data that will not enhance analysis. We also need to store a third date dimension, the registration date, which will help the marketing staff or the managers analyze the success of advertising campaigns.
You might have noticed that we haven’t discussed a dimension to store information about the evaluations that students use to rate the instructors. The company collects these evaluations daily in some classes, and only once for the whole class in others. The evaluation ratings are grouped into two areas: the instructor and everything else (e.g., environment, textbook). The question becomes, then, should evaluation ratings be stored as facts or as a dimension? In general, you need to include the information you know beforehand in the dimensions and record the information that you uncover through the business process in the fact table. For example, we need to store the evaluation ratings, which are always uncovered during the delivery of the class, as part of the fact table. If the evaluations are collected daily, we might want to consider storing each day of the class individually, which would let us analyze the course content for a particular day and determine what materials are more or less effective than others. To make that method effective, we also would need to change the course dimension to break down content presented per day in order to support this expansion. Because that information isn’t currently tracked, we would need to enhance the source data structures to allow the instructor to report on what material they covered each day. Courses are broken into individual modules, so the time dimension grain of day might not be effective, either. We could expand into start and stop hours. But this method would lead to an analysis of whether modules are more or less effective before or after lunch, etc. As you can see, the problem of choosing the right grain rapidly escalates.
How do you determine the right grain in this case? You need to estimate the cost of collecting and storing the additional information. Then you need to project the potential cost benefits of knowing what material generates more student satisfaction. The bottom line is to use common sense. Although a high level of detail would provide some potential benefit if the information were scrupulously used to improve courseware, collecting and maintaining the information probably doesn’t offer enough benefit to justify the expense. Therefore, we’ll add two facts to our fact table—an aggregated instructor satisfaction score and an aggregated class environment score.

Step 5: Create a Star Schema

The star schema in Figure 2 has only seven dimensions, which might seem to be too few. However, this star schema is typical. If you find that you have too few dimensions (only 2 or 3) or that you’re creating a star schema with 15 or 20 dimensions, you might want to reconsider your design. It would generally be better to either create fewer, larger dimensions or multiple star schemas. Whenever possible, design and use dimensions that can be used by other cubes. A well-planned customer dimension could serve many star-schema structures. This method is known as conformed dimensions. This helps simplify analysis by allowing you to create smaller star schemas, each one focused on a single business question. Later, the conformed dimensions form a bridge to combine data from multiple cube structures to form virtual cubes.

Step 6: Specify Data Points

Now that we’ve made initial decisions about which dimensions we have and the grain of the fact table we’ll use, we need to specify the data points to store in the fact table. The data points are the key performance indicators that occur when a class event occurs (e.g., the student evaluation, the revenue, etc.). For example, most students take only a few of the many classes that the company offers. Including a row in the fact table for a class that the student didn’t attend usually isn’t necessary, although you might find cases in which including a row is desirable. Each row will then contain a foreign key that points to each dimension and additional columns for the data you collect. Measures are the columns for that data.
We’ve already introduced some measures—the evaluation ratings. As we mentioned, you aggregate these ratings to store two measures for each student per class. When the OLAP cube is processed, the measures will be aggregated to match the hierarchies in the dimensions. Measures such as revenue are additive. You can roll all the students in a company up and determine the revenue by adding the revenue for each student. Evaluation scores, however, are not additive. In this case, the aggregation function should be set to average. We store the average rating for Instructor and the average rating for Other in each row of the fact table. We also need to store the invoiced amount that each student is charged. We then set a flag in a binary measure to track, for example, whether a student stayed at a hotel, which adds to the student’s overall cost. Finally, we store the student’s reason for attending the class. This last value isn’t numeric, so it’s not a measure; instead, it’s called a degenerate dimension. Degenerate dimensions contain only one column of data so they don’t need to be in their own distinct table. Thus, the fact table consists of a composite primary key built from a foreign-key value from each of the dimension tables. The fact table has a column for each performance indicator (Instructor rating, other rating, revenue, hotel) and a column for the degenerate dimension.

Step 7: Select the Columns

The final task is to select the columns to include in each dimension table. The Course dimension will include the course name, Microsoft course number if it exists, version indicator, length of the course, and maximum number of students. You can calculate the course’s length from the start and end dates in the fact table. However, in a data-warehousing environment, it’s almost always better to look up the course’s length than to calculate it because you’re working with so much data (in data warehouses, remember that you’re exchanging space for speed). The Student dimension will contain first name, middle name, last name, city, ZIP code, state, country, and company name as columns. At first, the Instructor dimension will contain only the Instructor name. In the future, we won’t store Instructor as a degenerate dimension in the fact table because we plan to store more information about instructors, such as certification level and years of experience. The Location dimension will contain the building name, city, ZIP code, state, and country. The StartDate, EndDate, and RegistrationDate dimensions will contain the date in a single column. The column will contain all the components of the date broken out by day of the week, month, quarter, and year.
In these seven steps, we chose a business process and identified the objects relevant to the process. Then we modeled the interaction of these objects with a star schema, which required us to define the dimensions, the grain of the fact table, and the measures to store in the fact table. The next step is to create a Data Transformation Services (DTS) package to extract the data from the sources, manipulate the data, and populate the data warehouse. If you follow these steps, you’ll be on your way to creating a well-designed data warehouse.

7 Steps to Data Warehousing

7 Steps to Data Warehousing

Data warehousing is a business analyst's dream—all the information about the organization's activities gathered in one place, open to a single set of analytical tools. But how do you make the dream a reality? First, you have to plan your data warehouse system. You must understand what questions users will ask it (e.g., how many registrations did the company receive in each quarter, or what industries are purchasing custom software development in the Northeast) because the purpose of a data warehouse system is to provide decision-makers the accurate, timely information they need to make the right choices.
Related: Data Warehousing Step-by-Step
To illustrate the process, we'll use a data warehouse we designed for a custom software development, consulting, staffing, and training company. The company's market is rapidly changing, and its leaders need to know what adjustments in their business model and sales practices will help the company continue to grow. To assist the company, we worked
with the senior management staff to design a solution. First, we determined the business objectives for the system. Then we collected and analyzed information about the enterprise. We identified the core business processes that the company needed to track, and constructed a conceptual model of the data. Then we located the data sources and planned data transformations. Finally, we set the tracking duration.
Step 1: Determine Business Objectives
The company is in a phase of rapid growth and will need the proper mix of administrative, sales, production, and support personnel. Key decision-makers want to know whether increasing overhead staffing is returning value to the organization. As the company enhances the sales force and employs different sales modes, the leaders need to know whether these modes are effective. External market forces are changing the balance between a national and regional focus, and the leaders need to understand this change's effects on the business.
To answer the decision-makers' questions, we needed to understand what defines success for this business. The owner, the president, and four key managers oversee the company. These managers oversee profit centers and are responsible for making their areas successful. They also share resources, contacts, sales opportunities, and personnel. The managers examine different factors to measure the health and growth of their segments. Gross profit interests everyone in the group, but to make decisions about what generates that profit, the system must correlate more details. For instance, a small contract requires almost the same amount of administrative overhead as a large contract. Thus, many smaller contracts generate revenue at less profit than a few large contracts. Tracking contract size becomes important for identifying the factors that lead to larger contracts.
As we worked with the management team, we learned the quantitative measurements of business activity that decision-makers use to guide the organization. These measurements are the key performance indicators, a numeric measure of the company's activities, such as units sold, gross profit, net profit, hours spent, students taught, and repeat student registrations. We collected the key performance indicators into a table called a fact table.

Step 2: Collect and Analyze Information

The only way to gather this performance information is to ask questions. The leaders have sources of information they use to make decisions. Start with these data sources. Many are simple. You can get reports from the accounting package, the customer relationship management (CRM) application, the time reporting system, etc. You'll need copies of all these reports and you'll need to know where they come from.

Another part of this collection and analysis phase is understanding how people gather and process the information. A data warehouse can automate many reporting tasks, but you can't automate what you haven't identified and don't understand. The process requires extensive interaction with the individuals involved. Listen carefully and repeat back what you think you heard. You need to clearly understand the process and its reason for existence. Then you're ready to begin designing the warehouse.

Step 3: Identify Core Business Processes

By this point, you must have a clear idea of what business processes you need to correlate. You've identified the key performance indicators, such as unit sales, units produced, and gross revenue. Now you need to identify the entities that interrelate to create the key performance indicators. For instance, at our example company, creating a training sale involves many people and business factors. The customer might not have a relationship with the company. The client might have to travel to attend classes or might need a trainer for an on-site class. New product releases such as Windows 2000 (Win2K) might be released often, prompting the need for training. The company might run a promotion or might hire a new salesperson.
The data warehouse is a collection of interrelated data structures. Each structure stores key performance indicators for a specific business process and correlates those indicators to the factors that generated them. To design a structure to track a business process, you need to identify the entities that work together to create the key performance indicator. Each key performance indicator is related to the entities that generated it. This relationship forms a dimensional model. If a salesperson sells 60 units, the dimensional structure relates that fact to the salesperson, the customer, the product, the sale date, etc.

Then you need to gather the key performance indicators into fact tables. You gather the entities that generate the facts into dimension tables. To include a set of facts, you must relate them to the dimensions (customers, salespeople, products, promotions, time, etc.) that created them. For the fact table to work, the attributes in a row in the fact table must be different expressions of the same event or condition. You can express training sales by number of seats, gross revenue, and hours of instruction because these are different expressions of the same sale. An instructor taught one class in a certain room on a certain date. If you need to break the fact down into individual students and individual salespeople, however, you'd need to create another table because the detail level of the fact table in this example doesn't support individual students or salespeople. A data warehouse consists of groups of fact tables, with each fact table concentrating on a specific subject. Fact tables can share dimension tables (e.g., the same customer can buy products, generate shipping costs, and return times). This sharing lets you relate the facts of one fact table to another fact table. After the data structures are processed as OLAP cubes, you can combine facts with related dimensions into virtual cubes.

Step 4: Construct a Conceptual Data Model

After identifying the business processes, you can create a conceptual model of the data. You determine the subjects that will be expressed as fact tables and the dimensions that will relate to the facts. Clearly identify the key performance indicators for each business process, and decide the format to store the facts in. Because the facts will ultimately be aggregated together to form OLAP cubes, the data needs to be in a consistent unit of measure. The process might seem simple, but it isn't. For example, if the organization is international and stores monetary sums, you need to choose a currency. Then you need to determine when you'll convert other currencies to the chosen currency and what rate of exchange you'll use. You might even need to track currency-exchange rates as a separate factor.
Now you need to relate the dimensions to the key performance indicators. Each row in the fact table is generated by the interaction of specific entities. To add a fact, you need to populate all the dimensions and correlate their activities. Many data systems, particularly older legacy data systems, have incomplete data. You need to correct this deficiency before you can use the facts in the warehouse. After making the corrections, you can construct the dimension and fact tables. The fact table's primary key is a composite key made from a foreign key of each of the dimension tables.
Data warehouse structures are difficult to populate and maintain, and they take a long time to construct. Careful planning in the beginning can save you hours or days of restructuring.

Step 5: Locate Data Sources and Plan Data Transformations

Now that you know what you need, you have to get it. You need to identify where the critical information is and how to move it into the data warehouse structure. For example, most of our example company's data comes from three sources. The company has a custom in-house application for tracking training sales. A CRM package tracks the sales-force activities, and a custom time-reporting system keeps track of time.
You need to move the data into a consolidated, consistent data structure. A difficult task is correlating information between the in-house CRM and time-reporting databases. The systems don't share information such as employee numbers, customer numbers, or project numbers. In this phase of the design, you need to plan how to reconcile data in the separate databases so that information can be correlated as it is copied into the data warehouse tables.
You'll also need to scrub the data. In online transaction processing (OLTP) systems, data-entry personnel often leave fields blank. The information missing from these fields, however, is often crucial for providing an accurate data analysis. Make sure the source data is complete before you use it. You can sometimes complete the information programmatically at the source. You can extract ZIP codes from city and state data, or get special pricing considerations from another data source. Sometimes, though, completion requires pulling files and entering missing data by hand. The cost of fixing bad data can make the system cost-prohibitive, so you need to determine the most cost-effective means of correcting the data and then forecast those costs as part of the system cost. Make corrections to the data at the source so that reports generated from the data warehouse agree with any corresponding reports generated at the source.
You'll need to transform the data as you move it from one data structure to another. Some transformations are simple mappings to database columns with different names. Some might involve converting the data storage type. Some transformations are unit-of-measure conversions (pounds to kilograms, centimeters to inches), and some are summarizations of data (e.g., how many total seats sold in a class per company, rather than each student's name). And some transformations require complex programs that apply sophisticated algorithms to determine the values. So you need to select the right tools (e.g., Data Transformation Services—DTS—running ActiveX scripts, or third-party tools) to perform these transformations. Base your decision mainly on cost, including the cost of training or hiring people to use the tools, and the cost of maintaining the tools.
You also need to plan when data movement will occur. While the system is accessing the data sources, the performance of those databases will decline precipitously. Schedule the data extraction to minimize its impact on system users (e.g., over a weekend).

Step 6: Set Tracking Duration

Data warehouse structures consume a large amount of storage space, so you need to determine how to archive the data as time goes on. But because data warehouses track performance over time, the data should be available virtually forever. So, how do you reconcile these goals?
The data warehouse is set to retain data at various levels of detail, or granularity. This granularity must be consistent throughout one data structure, but different data structures with different grains can be related through shared dimensions. As data ages, you can summarize and store it with less detail in another structure. You could store the data at the day grain for the first 2 years, then move it to another structure. The second structure might use a week grain to save space. Data might stay there for another 3 to 5 years, then move to a third structure where the grain is monthly. By planning these stages in advance, you can design analysis tools to work with the changing grains based on the age of the data. Then if older historical data is imported, it can be transformed directly into the proper format.

Step 7: Implement the Plan

After you've developed the plan, it provides a viable basis for estimating work and scheduling the project. The scope of data warehouse projects is large, so phased delivery schedules are important for keeping the project on track. We've found that an effective strategy is to plan the entire warehouse, then implement a part as a data mart to demonstrate what the system is capable of doing. As you complete the parts, they fit together like pieces of a jigsaw puzzle. Each new set of data structures adds to the capabilities of the previous structures, bringing value to the system.
Data warehouse systems provide decision-makers consolidated, consistent historical data about their organization's activities. With careful planning, the system can provide vital information on how factors interrelate to help or harm the organization. A solid plan can contain costs and make this powerful tool a reality.

  DAILY CHECKLIST Oracle Database instance is running or not select name,open_mode from V$database; Note: Check the Oracle databases are ru...