Wednesday, November 21, 2018

CentOS / RHEL 6 : How to list or install only security updates with yum

CentOS / RHEL 6 : How to list or install only security updates with yum


Question: Is it possible to limit yum so that it lists or installs only security updates? How to patch the system only with security errata ?

Answer :

Install the yum-security plugin

It is now possible to limit yum to install only security updates (as opposed to bug fixes or enhancements) by installing the yum-security plugin. Contrary to RHEL 7, in RHEL 6 the yum-security plugin is not part of yum. So to install the plugin use :
# yum install yum-plugin-security

listing available erratas

To list all available erratas without installing them, run:
# yum updateinfo list available

Listing available security updates

To list all available security updates without installing them, run:

# yum updateinfo list security all
# yum updateinfo list sec
To list all available security updates with verbose descriptions of the issues they apply to:
# yum info-sec

Listing currently installed security updates

To get a list of the currently installed security updates this command can be used:
# yum updateinfo list security installed

Installing available security updates

Run the following command to download and apply all available security updates :
# yum -y update --security
NOTE: It will install the last version available of any package with at least one security errata thus can install non-security erratas if they provide a more updated version of the package.
To only install the packages that have a security errata use
# yum update-minimal --security -y
For more commands consult the manual pages of yum-security with
# man yum-security

ULN-CA-CERT (SHA-2) Certificates to be Updated on October 9, 2018 (Doc ID 2454202.1)


In this Document
Description
Occurrence
Symptoms
Workaround
History


Applies to:

Linux OS - Version Oracle Linux 5.0 and later
Oracle Linux Cloud Service
Linux x86-64
Linux x86
Linux Itanium
Linux ARM 64-bit

Description

Oracle is replacing Symantec-branded certificates with Digicert-branded certificates across all of its infrastructure to prevent trust warnings from Chrome and Firefox.

Occurrence

Due to the nature of how Oracle Linux systems connect to Unbreakable Linux Network (ULN), this change requires that client certificates on all Oracle Linux systems receiving updates from ULN be updated. The change in server certificates on ULN will occur on October 9, 2018. After that time, Oracle Linux systems will only be able to connect to ULN with an updated client certificate.

Symptoms

You may encounter the following errors if certificate is not updated:
The certificate /usr/share/rhn/ULN-CA-CERT is expired. Please ensure you
have the correct certificate and your system time is correct.
Or:
There was an SSL error: [('SSL routines', 'SSL3_GET_SERVER_CERTIFICATE', 'certificate verify failed')]
A common cause of this error is the system time being incorrect. Verify that the time on this system is correct.
Or:

# yum repolist

The SSL certificate failed verification.
You have new mail in /var/spool/mail/root 
 Or:

# uln-yum-mirror

Traceback (most recent call last):
File "<string>", line 14, in <module>
AttributeError: 'Error' object has no attribute 'faultString'
...
File "/usr/share/rhn/up2date_client/rhnserver.py", line 68, in __call__
raise up2dateErrors.SSLCertificateVerifyFailedError()
up2date_client.up2dateErrors.SSLCertificateVerifyFailedError: The SSL certificate failed verification.

Workaround

Please make sure to have following or later version of the packages installed on the system before October 9, 2018.
Oracle Linux 7
rhn-client-tools-2.0.2-21.0.9.el7.noarch.rpm
rhn-setup-2.0.2-21.0.9.el7.noarch.rpm
rhn-check-2.0.2-21.0.9.el7.noarch.rpm
rhn-setup-gnome-2.0.2-21.0.9.el7.noarch.rpm (if the older version of this package is installed)

Oracle Linux 6
rhn-setup-1.0.0.1-45.0.3.el6.noarch.rpm
rhn-client-tools-1.0.0.1-45.0.3.el6.noarch.rpm
rhn-check-1.0.0.1-45.0.3.el6.noarch.rpm
rhn-setup-gnome-1.0.0.1-45.0.3.el6.noarch.rpm (if the older version of this package is installed)

Oracle Linux 5
x86_64:
up2date-5.10.1-41.30.el5.x86_64.rpm
up2date-gnome-5.10.1-41.30.el5.x86_64.rpm (if the older version of this package is installed)
i386:
up2date-5.10.1-41.30.el5.i386.rpm
up2date-gnome-5.10.1-41.30.el5.i386.rpm (if the older version of this package is installed)
ia64:
up2date-5.10.1-41.30.el5.ia64.rpm
up2date-gnome-5.10.1-41.30.el5.ia64.rpm (if the older version of this package is installed)
After October 9, 2018, you have to run the following steps to update the client SSL certificate on your Oracle Linux machine:

# cp /usr/share/rhn/ULN-CA-CERT /usr/share/rhn/ULN-CA-CERT.old
# wget https://linux-update.oracle.com/rpms/ULN-CA-CERT.sha2
# cp ULN-CA-CERT.sha2 /usr/share/rhn/ULN-CA-CERT

Reference: Unbreakable Linux Network - FAQ

Tuesday, November 13, 2018

Configure Dnsmasq for Oracle Linux for RAC scan address Configured

Configure Dnsmasq for Oracle Linux for RAC scan address Configured

1. Install the DNSMASQ on Oracle Linux

yum install dnsmasq

2. Configured if for automatic start on Linux reboot

chkconfig dnsmasq on

3. For configuring for Setup SCAN address for RAC Instances:
Dnsmasq is configured by altering the file “/etc/dnsmasq.conf” and “/etc/hosts”.
We make entries in /etc/hosts file for configuring the IP addresses used by RAC Environment.

cat /etc/hosts
# Public
192.168.56.101 rac1.localdomain rac1
192.168.56.102 rac2.localdomain rac2
# Private
192.168.1.101 rac1-priv.localdomain rac1-priv
192.168.1.102 rac2-priv.localdomain rac2-priv
# Virtual
192.168.56.103 rac1-vip.localdomain rac1-vip
192.168.56.104 rac2-vip.localdomain rac2-vip
# SCAN
192.168.56.105 rac-scan.localdomain rac-scan
192.168.56.106 rac-scan.localdomain rac-scan
192.168.56.107 rac-scan.localdomain rac-scan

4. Now configure the /etc/resolv.conf file.

cat /etc/resolv.conf
#domain localdomain
search localdomain
nameserver 192.168.56.1

5. Edit the /etc/dnsmasq.conf file:

local=/localdomain/

6. Start the dnsmasq process

service dnsmasq stop
service dnsmasq start
service dnsmasq restart

7. Test by nslookup commands as follows:

nslookup rac-scan
;; connection timed out; no servers could be reached

8. If nslookup gives timeout error then you need to modify the vi/etc/resolv.conf file.
Add one entry of local address because dnsmasq is running by default on 127.0.0.1 address

cat /etc/resolv.conf
#domain localdomain
nameserver 127.0.0.1
search localdomain
nameserver 192.168.56.1

9. Protect and Restart the dnsmasq process.

--Changes its attribute for changing in reboot.
chattr +i /etc/resolv.conf
-- Start the Service.
service dnsmasq restart

10. Check again the nslookup command, it works.

nslookup rac-scan
[root@rac1 ~]# nslookup rac-scan
Server: 127.0.0.1
Address: 127.0.0.1#53

Name: rac-scan.localdomain
Address: 192.168.56.105
Name: rac-scan.localdomain
Address: 192.168.56.106
Name: rac-scan.localdomain
Address: 192.168.56.107

In upper case it is using the /etc/hosts file for resolve the name, if you want to configured own file instead for resolved the scan ip address in DNSMASQ
1. Install the dnsmasq and configured it for next reboot

yum install dnsmasq
chkconfig dnsmasq on

2. Create the new file having entry of SCAN ip address

cat /etc/scanipaddress
# SCAN
192.168.56.105 rac-scan.localdomain rac-scan
192.168.56.106 rac-scan.localdomain rac-scan
192.168.56.107 rac-scan.localdomain rac-scan

3. Modify one parameter addn-hosts in default configuration file ‘/etc/dnsmasq.conf’.

cat /etc/dnsmasq.conf | grep addn-hosts
addn-hosts=/etc/scanipaddress

4. Configure resolv.conf file as above steps:

cat /etc/resolv.conf
#domain localdomain
nameserver 127.0.0.1
search localdomain
nameserver 192.168.56.1

5. Protect file from overwritten by host reboot

[root@rac1 ~]# chattr +i /etc/resolv.conf

6. Start the Service of dnsmasq and check nslookup command

service dnsmasq restart
nslookup rac-scan

Friday, November 9, 2018

INS-40912 virtual host name znode1-vip.anbob.com is assigned to another system n the network.

INS-40912 virtual host name znode1-vip.anbob.com is assigned to another system n the network.


<!--StartFragment -->
[root@rac2 ~]# cat /etc/hosts
# Do not remove the following line, or various programs
# that require network functionality will fail.
127.0.0.1  localhost.localdomain localhost
::1  localhost6.localdomain6 localhost6

###eth0-Public IP###
192.168.0.55  rac1
192.168.0.56  rac2
###eth1–PRIVATE IP###
192.168.1.102 rac1-priv
192.168.1.101 rac2-priv
###VIP###
192.168.0.57 rac1-vip
192.168.0.58 rac2-vip
###SCAN###
192.168.0.70  rac-cluster-scan

 跟高手谈话内容如下:

这是个虚拟IP,当前你应该ping不通。
目前你还没安装,暂时不会绑到网卡上。<!--StartFragment -->
这个应该在RAC安装完,启动成功后,才会随机往两台机器上的其中一个网卡绑定。
当其中一台机器坏了,自动飘移到另一台
解决办法:ifconfig eth0:0 192.168.0.57 netmask 255.255.255.0 down

Configure SCAN DNS for RAC 11G RAC 12C using dnsmasq in OEL5, OEL6, OEL7

Configuration of network for virtualbox and RAC is always making a lot of trouble and raises many questions. In this article I’ll show how to setup network for RAC 11G, 12C using dnsmasq.
Objectives to complete:
  • full network setup for RAC
    • public network
    • private network
    • SCAN settings resolved by dnsmasq
  • full access to internet from each RAC hosts
    • internet network
  • configure dnsmasq

In my articles for RAC I usually have three network cards for each of my node with following settings on VirtualBox
Adapter1 – used for public RAC interface
rac6_oel6
Adapter2 – used for private RAC interface
rac7_oel6
Adapter3 – used for internet connections
rac8_oel6
and two host machines with following settings
  • rac1.dbaora.com
  • rac2.dbaora.com
publicprivatevip
rac1192.168.0.50192.168.56.60192.168.0.70
rac2192.168.0.51192.168.56.61192.168.0.71
with single client access name (SCAN) address
public
rac-scan192.168.0.20
192.168.0.21
192.168.0.22
My WIFI router generates ip adress like 192.168.1.X so it doesn’t interfere with RAC public, private and SCAN. It’s important to have your internet network on separate subnet.
So my entry in “/ect/hosts” looks following. As you can notice SCAN entries are commented and will be resolved via dnsmasq.
127.0.0.1     localhost.localdomain localhost

#public
192.168.0.50   rac1        rac1.dbaora.com
192.168.0.51   rac2        rac2.dbaora.com

#private
192.168.56.60  rac1-priv   rac1-priv.dbaora.com 
192.168.56.61  rac2-priv   rac2-priv.dbaora.com

#virtual
192.168.0.70   rac1-vip    rac1-vip.dbaora.com
192.168.0.71   rac2-vip    rac2-vip.dbaora.com

#scan
#192.168.0.20   rac-scan    rac-scan.dbaora.com
#192.168.0.21   rac-scan    rac-scan.dbaora.com
#192.168.0.22   rac-scan    rac-scan.dbaora.com
Install and configure dnsmasq
1. To install dnsmasq run as root following command
yum install dnsmasq
2. Configure dnsmasq
create new file “/etc/racdns” with settings for SCAN
[root@rac1 ~]# cat /etc/racdns
#scan
192.168.0.20   rac-scan    rac-scan.dbaora.com
192.168.0.21   rac-scan    rac-scan.dbaora.com
192.168.0.22   rac-scan    rac-scan.dbaora.com
modify dnsmasq default configuration file “/etc/dnsmasq.conf”. One parameter addn-hosts should be changed to point to file “/etc/racdns”.
[root@rac1 ~]# cat /etc/dnsmasq.conf | grep addn-hosts
addn-hosts=/etc/racdns
3. Start dnsmasq
service dnsmasq start
chkconfig dnsmasq on
4. Next step is to resolve problem with file “/etc/resolv.conf”
I’m using third network card as NAT with DHCP so each time you restart network card or reboot host the file is overwritten with automatically generated settings. Nameserver points for 192.168.1.1 which is required to resolve internet entries but not enough to resolve SCAN settings via dnsmasq.
[root@rac1 ~]# cat /etc/resolv.conf
# Generated by Networkmanager
search dbaora.com
nameserver 192.168.1.1
As default dnsmasq is running on ip adress 127.0.0.1 so it requires following settings in “/etc/resolv.conf”.
[root@rac1 ~]# cat /etc/resolv.conf
# Generated by Networkmanager
nameserver 127.0.0.1
search dbaora.com
nameserver 192.168.1.1
You must protect the file from being automatically overwritten by host reboot, network card restart etc.
[root@rac1 ~]# chattr +i /etc/resolv.conf
Verification
It’s just running nslookup to verify all is working fine
rac-scan
[root@rac1 ~]# nslookup rac-scan
Server:        127.0.0.1
Address:    127.0.0.1#53

Name:    rac-scan.dbaora.com
Address: 192.168.0.22
Name:    rac-scan.dbaora.com
Address: 192.168.0.20
Name:    rac-scan.dbaora.com
Address: 192.168.0.21

[root@rac1 ~]# nslookup rac-scan
Server:        127.0.0.1
Address:    127.0.0.1#53

Name:    rac-scan.dbaora.com
Address: 192.168.0.20
Name:    rac-scan.dbaora.com
Address: 192.168.0.21
Name:    rac-scan.dbaora.com
Address: 192.168.0.22

[root@rac1 ~]# nslookup rac-scan
Server:        127.0.0.1
Address:    127.0.0.1#53

Name:    rac-scan.dbaora.com
Address: 192.168.0.21
Name:    rac-scan.dbaora.com
Address: 192.168.0.22
Name:    rac-scan.dbaora.com
Address: 192.168.0.20
rac1, rac2, rac1-priv, rac2-priv, rac1-vip, rac2-vip
[root@rac1 ~]# nslookup rac1
Server:        127.0.0.1
Address:    127.0.0.1#53

Name:    rac1.dbaora.com
Address: 192.168.0.50

[root@rac1 ~]# nslookup rac2
Server:        127.0.0.1
Address:    127.0.0.1#53

Name:    rac2.dbaora.com
Address: 192.168.0.51

[root@rac1 ~]# nslookup rac1-priv
Server:        127.0.0.1
Address:    127.0.0.1#53

Name:    rac1-priv.dbaora.com
Address: 192.168.56.60

[root@rac1 ~]# nslookup rac2-priv
Server:        127.0.0.1
Address:    127.0.0.1#53

Name:    rac2-priv.dbaora.com
Address: 192.168.56.61

[root@rac1 ~]# nslookup rac1-vip
Server:        127.0.0.1
Address:    127.0.0.1#53

Name:    rac1-vip.dbaora.com
Address: 192.168.0.70

[root@rac1 ~]# nslookup rac2-vip
Server:        127.0.0.1
Address:    127.0.0.1#53

Name:    rac2-vip.dbaora.com
Address: 192.168.0.71

Thursday, November 1, 2018

Linux Administration for DBA’s: Checking Disk Space

Linux Administration for DBA’s: Checking Disk Space

Problem
With the 2016 release of SQL Server, Microsoft has decided to expand SQL Server operating systems to Linux servers. Since most of the SQL Server administrators are not familiar working with Linux, you may not know how to check for disk space usage. In this tip I will show you how to check file sizes and disk space usage when using SQL Server on Linux.
Solution
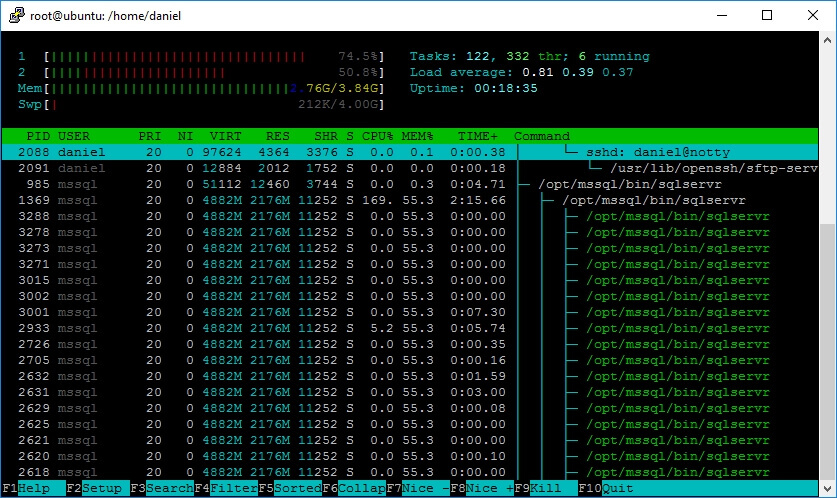
When working with Linux, most of the time you will have to use a remote shell connection. That's because nobody installs the GUI on production servers due to the fact that on Linux you can do everything from the console.

The ls Command

This command, according to the manual page (man ls), lists directory contents, just like the dir command on Windows. But there are some peculiarities that may confuse Windows users. For instance, if you run ls without any argument it just returns a list of archives without information of the file size, like when you run 
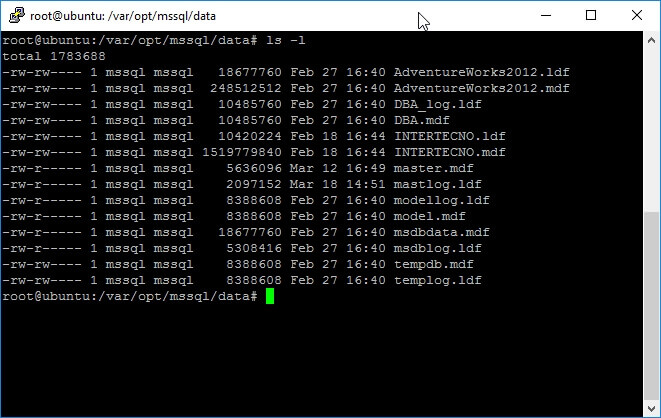
dir /w on Windows. In order to get a full list of files you should run the ls command with the -l argument as shown below.
ls –l
The next image is a screen capture of the previous command execution. We can see that on the first line this command informs the total size of the files being listed and the rest of the output is a grid that shows information about each file.
Using ls -l to list the contents of SQL Server data directory.
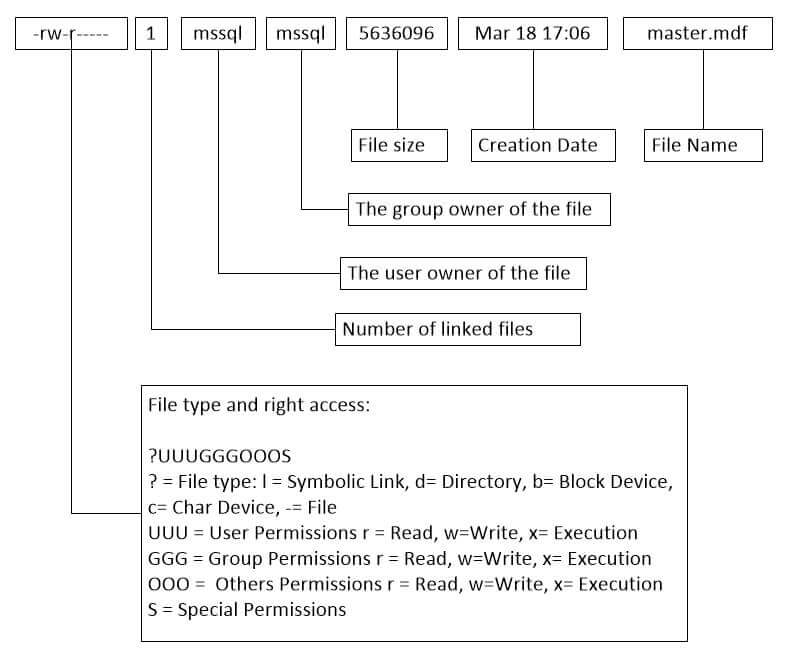
On the following chart I explain what each column of the grid is for.
This is what each result column means.
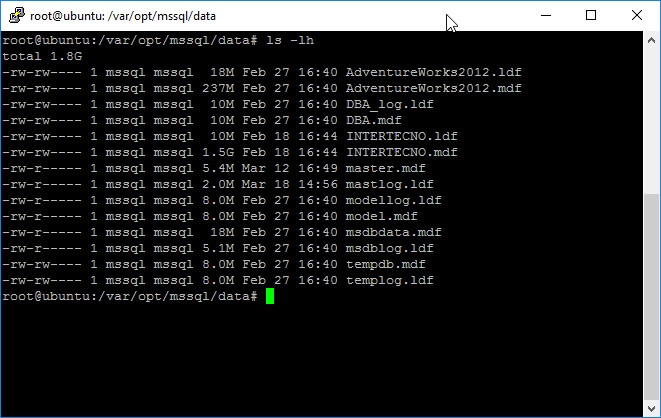
As you may have noticed, the file size is expressed in bytes, but for large database files this is useless, so we need to view the file sizes in an easier to read format. For this, adding the h argument will do the work as follows.
ls –lh

Now with the -h argument sizes are more legible.

The df Command

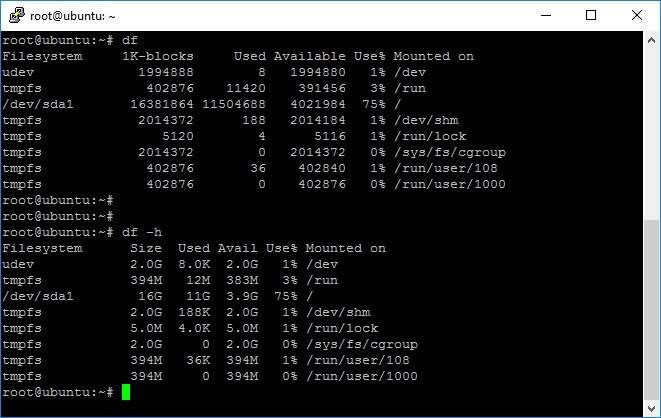
This command displays the used and available disk space and the mounting point of the file systems.
df [OPTION]... [FILE]...
To get the full list of available options I suggest you read the df Manual Page.
To make the output easier to read for the file sizes, we will use –h to print the results in MB, GB and so on.
df

df -h

Execution of df command with and without the -h parameter.
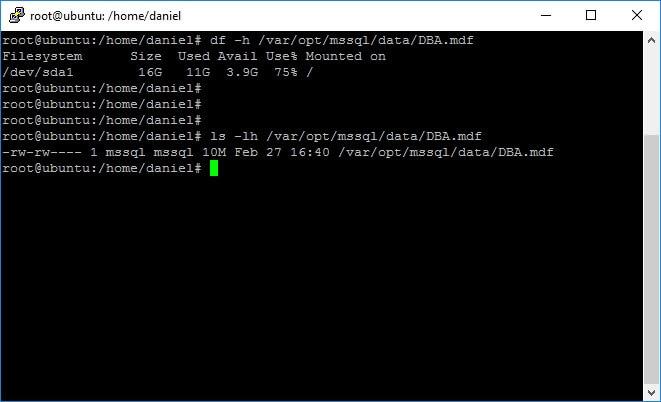
You can also pass as an argument a file name or a directory and it tells you the used and available free space on the underlying disk. Please note on the next screen capture that I executed the df command passing a file argument and the used space reported by df, which is the used drive space. This differs from the file size reported by the ls command.
df -h /var/opt/mssql/data/DBA.mdf

You can pass a file argument to df to see the underlying disk space stats. It will not show you file size details, use ls instead.

The du Command

The du (i.e. disk usage) command shows the size of a given directory tree and its subfolders and files (if you use the * or –a switch). Something to note is that you need to have read permission on the folders and files in order to get their size, so if you are looking only for a file size I would suggest using ls –l instead.
du [OPTION]... [FILE]...
When du is executed with de –a switch it returns the size of all files and folders, even the hidden ones (those whose name starts with a dot “.”) that are not displayed with the * argument. The du command also accepts the 
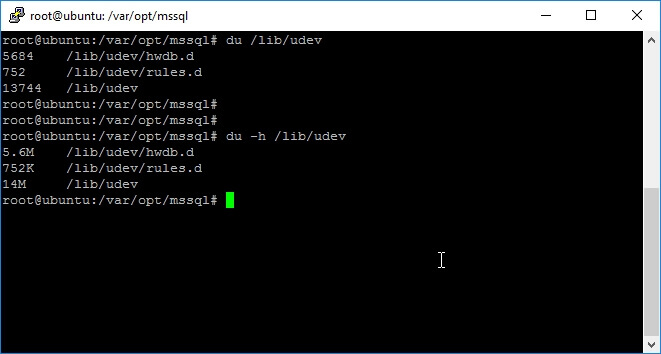
–h switch to display the results in human readable form, which is much easier to read. The next screen capture shows the execution of du with and without -h parameter.
du /lib/udev

du -h /lib/udev

Screen capture of du command execution.
Something to note is that we can use pipes (the | character) to redirect the output of one command to another. We can take advantage of this feature to sort the output of the du command by sending its content to the sort command. The following code shows how to sort the output of du. The –n switch of the sort command is to let the sort command know that we want a numeric sort and not a character one.
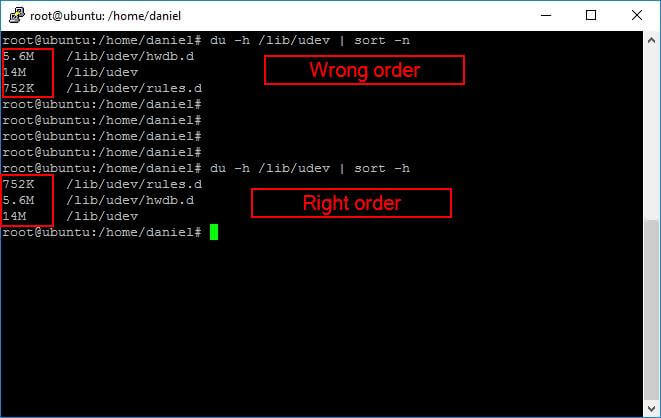
du | sort -n
But if you use the –h switch of du command and want to order its output as a numeric sort like in the following code, you may have bogus results.
du -h | sort -n
This must not surprise you, because even when the command du –h returns a number on its first column, that number carries an underlying size measure unit (GB, MB and so on). So we must change the sort command a little bit: instead of the –n switch we must use the –h switch, and yes, the -h is for human readable.
du -h | sort –h
In the following screen capture I show you the difference of piping the du –h command with those variants of the sort command.
du -h /lib/udev | sort –n

du -h /lib/udev | sort –h

Now you can run SQL Server tools from any folder.

Linux Administration for DBA’s: Checking CPU Usage

Linux Administration for DBA’s: Checking CPU Usage

Problem
With the 2016 release of SQL Server Microsoft has decided to expand SQL Server to run on Linux servers. Since most SQL Server DBA's are not used to working with Linux, there are common tasks like checking for free disk space or CPU consumption that may be difficult. In this tip I will make a short list of what we need to know about Linux administration to start using SQL Server on Linux.
Solution
Here we will cover some of the key things you shown know.

TOP command

The most basic console command to check CPU consumption is top. The output of this command consists of a header that shows general information and a grid with the information per process. Take a look at the next screen capture.
Screen capture of Linux top command.
For those of us used to Windows, it is important to understand what each line means, so I will go line by line describing its meaning.

Line 1

  • Current system time
  • Time since the system was powered on
  • Number of logged on users
  • Load Average measured at intervals of 5, 10 and 15 minutes
On Linux systems the Load Average measures the percentage queued tasks (either CPU or IO) over a specific timeframe. This value also depends on the number of CPU cores. For example, a system with one core with a load average of 1 has a full load, but if the system has two cores it has a half load. As a rule of thumb, if the load average is a number greater than the number of cores of your system it means that your system is under stress. Keep in mind that the load average could be a number far greater than the number of cores on your system due to waiting tasks.

Line 2

  • Number of total Tasks
  • Number of tasks actually running
  • Number of processes waiting for an event to continue execution
  • Number of stopped tasks
  • Number of processes in zombie state
Here we need to explain what a zombie process is. On a Linux system, when a child process finishes it keeps the process id on the processes table, so the parent process can read the child process exit status. That finished child process is called a zombie. After the parent process reads the child exit status the zombie is removed. The problem with zombies is that Linux has a limited number of process ids (which you can find by reading the file /proc/sys/kernel/pid_max) and in very rare circumstances this may lead to a lack of resources.

Line 3

This line shows information regarding CPU time usage.
  • Percentage CPU Time in User Mode
  • Percentage CPU Time in System Mode
  • Percentage CPU Time in Low Priority User Mode (Linux calls it Nice Priority)
  • Percentage CPU Idle Time
  • Percentage CPU Time Waiting for I/O
  • Percentage CPU Time Servicing Hardware Interrupts
  • Percentage CPU Time Servicing Software Interrupts
  • Percentage CPU Time Virtual CPU waits for a real CPU while the hypervisor is servicing another virtual processor (This is called Stolen Time)

Line 4

This line gives us information about our system’s physical memory.
  • Total Memory
  • Free Memory
  • Used Memory
  • Memory used by Buffer Cache

Line 5

This line shows information about the swap partitions, the equivalent to Windows pagefile.
  • Total Swap partitions space.
  • Free Swap partitions space.
  • Used Swap space.
  • Available Physical Memory.

Process Grid

The lower panel of the top command displays a grid with information regarding running processes.
Column
Description
PIDThe Process Identifier
USERUser who owns the Process
PRProcess Priority. If you see RT on this column that means the process is running on Real Time.
NINice Priority. If it is a negative value that means the process is running on high priority. A positive value means the process is running on low priority.
VIRTAmount of Virtual Memory used by the process expressed in kilobytes.
RESAmount of Physical Memory used by the process expressed in kilobytes.
SHRAmount of Shared Memory expressed in kilobytes.
SProcess status
D = uninterruptible sleep
R = running
S = sleeping
T = stopped by job control signal
t = stopped by debugger during trace
Z = zombie
%CPUThe percentage usage of CPU by the given task. If you see a number greater than 100% don’t panic, that’s because top command is not running in thread mode.
%MEMThe percentage of Physical Memory used by the process.
TIME+Amount of CPU Time used by the process.
COMMANDThe command who started the process.

HTOP as an alternative

There is an alternative to top which is a Linux monitoring tool called htop (http://hisham.hm/htop/). The advantage of this tool is that it uses color and shows information about CPU, Memory and Swap as graphic bars.
Screen capture of htop command output.
Usually this tool is not available on base Linux installations, so you will have to install it from your distribution repositories or downloading the packages from the htop website.
If you are using Ubuntu, the following command will install htop.
sudo apt-get  install htop

Linux Administration for DBA’s: Checking Disk I/O

Linux Administration for DBA’s: Checking Disk I/O

Problem
With the upcoming release of SQL Server, Microsoft has decided to expand operating system support to Linux servers. We as Database Administrators need to know how the underlying disks subsystems are performing. Since most of the SQL Server Administrators are not used to work with Linux, you may not know how to do this task. In this tip I will show you some tools that will help you.
Solution
One of the duties of a Database Administrator is to ensure that the storage subsystem that supports our databases is performing properly. Of course, we have the I/O Related Dynamic Management Views and Functions like sys.dm_io_pending_io_requests and sys.dm_io_virtual_file_stats, but sometimes that is not enough. In fact, we are used to looking at disk related performance counters on servers running on Windows and even use other tools like the one explained by Ben Snaidero in the following tip: Gather Storage Subsystem Performance Metrics Using the Diskspd Utility for SQL Server Applications.

Available Linux Tools

Now that SQL Server also runs on Linux we must get familiar with the existing tools that will allow us to do our work just like we do on Windows.

iostat

This is the most basic command to check for disk I/O and you will generally have it installed by default, but if not you can install the sysstat package that includes the iostat tool.
apt-get install sysstat
   
Basically this command shows CPU and I/O statistics for devices and partitions as two separate reports, but with arguments –c and –d you can force it to only display either the CPU or the devices report respectively. For the purposes of this tip, I will focus the attention to the I/O report.
Screen capture of the iostat command execution
As you can see on the previous image the command shows a table with one row for each installed device and four columns that informs us about the Transfer per Second (tps), reads and writes per second expressed in kilobytes and the amount of kilobytes read and written.
By now we have seen a static picture of our I/O performance, but this command also allows us to keep it running at a specified interval of time (in seconds). When we run iostat with an interval it changes its behavior, and for every run it will show us the delta of reads and writes from the previous execution. The following command shows every four seconds the device usage report until Control + C is pressed.
iostat –d 4
   
On the following screen capture is the output of the previous command execution.
Execution of iostat with a four seconds interval.
But this tool has already more features. When iostat is executed with the –x parameter it returns extended statistics. The most helpful statistics are in the columns avgqu-sz, which is the average queue length; and a wait that refers to the time spent queuing and servicing a request. Below are two screen captures with the output of this command.
iostat Extended Statistics Left - Description: Screen capture of the execution of iostat with extended statistics, left part.

iostat Extended Statistics Right - Description: Screen capture of the execution of iostat with extended statistics, right part.
On the next table I copied the man page description of each column from the pictures.
Column Description
rrqm/s The number of read requests merged per second that were queued to the device.
wrqm/s The number of write requests merged per second that were queued to the device.
r/s The number of read requests that were issued to the device per second.
w/s The number of write requests that were issued to the device per second.
rkB/s The number of kilobytes read from the device per second.
wkB/s The number of kilobytes written to the device per second.
avgrq-sz The average size (in sectors) of the requests that were issued to the device.
avgqu-sz The average queue length of the requests that were issued to the device.
await The average time (in milliseconds) for I/O requests issued to the device to be served. This includes the time spent by the requests in queue and the time spent servicing them.
r_await The average time (in milliseconds) for read requests issued to the device to be served. This includes the time spent by the requests in queue and the time spent servicing them.
w_await The average time (in milliseconds) for write requests issued to the device to be served. This includes the time spent by the requests in queue and the time spent servicing them.
svctm The average service time (in milliseconds) for I/O requests that were issued to the device. Warning! Do not trust this field any more. This field will be removed in a future sysstat version.
%util Percentage of CPU time during which I/O requests were issued to the device (bandwidth utilization for the device). Device saturation occurs when this value is close to 100%.

iotop

This utility displays the I/O usage per process or threads on an interactive grid that resembles the htop utility.
iotop - Description: This is how iotop utility looks like.
As you can see on the previous image, this utility shows the threads or processes (I will show you how to change amongst the two shortly when I outline its arguments). Most of the columns are self-explanatory, just to mention that the IO column lists the total I/O for each process including disk use and swap; and SwapIn lists the swap activity for each process.
Following is a table with the most used parameters.
Parameter Description
-oOnly show processes or threads actually doing I/O, instead of showing all processes or threads. This can be dynamically toggled by pressing o.
-b Turn on non-interactive mode (batch mode). Useful for logging I/O usage over time.
-P Only show processes. Normally iotop shows all threads.
-a Show accumulated I/O instead of bandwidth. In this mode, iotop shows the amount of I/O processes have done since iotop started.
But being iotop an interactive utility, there are some keyboard shortcuts that are helpful.
Key Description
left and right arrows Changes the sorting column.
r Reverses the sorting order.
o Shows only processes or threads actually doing I/O.
p Show processes instead of threads.
a Display accumulated I/O instead of bandwidth.
i Changes the priority of a thread or process.

  How to Change Instance Type & Security Group of EC2 in AWS By David Taylor Updated April 29, 2023 EC2 stands for Elastic Compute Cloud...