Linux Administration for DBA’s: Checking CPU Usage
ProblemWith the 2016 release of SQL Server Microsoft has decided to expand SQL Server to run on Linux servers. Since most SQL Server DBA's are not used to working with Linux, there are common tasks like checking for free disk space or CPU consumption that may be difficult. In this tip I will make a short list of what we need to know about Linux administration to start using SQL Server on Linux.
Solution
Here we will cover some of the key things you shown know.TOP command
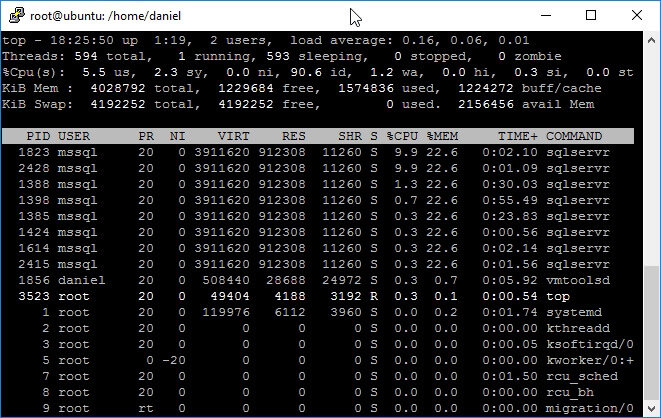
The most basic console command to check CPU consumption is top. The output of this command consists of a header that shows general information and a grid with the information per process. Take a look at the next screen capture.
Line 1
- Current system time
- Time since the system was powered on
- Number of logged on users
- Load Average measured at intervals of 5, 10 and 15 minutes
Line 2
- Number of total Tasks
- Number of tasks actually running
- Number of processes waiting for an event to continue execution
- Number of stopped tasks
- Number of processes in zombie state
Line 3
This line shows information regarding CPU time usage.- Percentage CPU Time in User Mode
- Percentage CPU Time in System Mode
- Percentage CPU Time in Low Priority User Mode (Linux calls it Nice Priority)
- Percentage CPU Idle Time
- Percentage CPU Time Waiting for I/O
- Percentage CPU Time Servicing Hardware Interrupts
- Percentage CPU Time Servicing Software Interrupts
- Percentage CPU Time Virtual CPU waits for a real CPU while the hypervisor is servicing another virtual processor (This is called Stolen Time)
Line 4
This line gives us information about our system’s physical memory.- Total Memory
- Free Memory
- Used Memory
- Memory used by Buffer Cache
Line 5
This line shows information about the swap partitions, the equivalent to Windows pagefile.- Total Swap partitions space.
- Free Swap partitions space.
- Used Swap space.
- Available Physical Memory.
Process Grid
The lower panel of the top command displays a grid with information regarding running processes.
Column
|
Description
|
|---|---|
| PID | The Process Identifier |
| USER | User who owns the Process |
| PR | Process Priority. If you see RT on this column that means the process is running on Real Time. |
| NI | Nice Priority. If it is a negative value that means the process is running on high priority. A positive value means the process is running on low priority. |
| VIRT | Amount of Virtual Memory used by the process expressed in kilobytes. |
| RES | Amount of Physical Memory used by the process expressed in kilobytes. |
| SHR | Amount of Shared Memory expressed in kilobytes. |
| S | Process status D = uninterruptible sleep R = running S = sleeping T = stopped by job control signal t = stopped by debugger during trace Z = zombie |
| %CPU | The percentage usage of CPU by the given task. If you see a number greater than 100% don’t panic, that’s because top command is not running in thread mode. |
| %MEM | The percentage of Physical Memory used by the process. |
| TIME+ | Amount of CPU Time used by the process. |
| COMMAND | The command who started the process. |
HTOP as an alternative
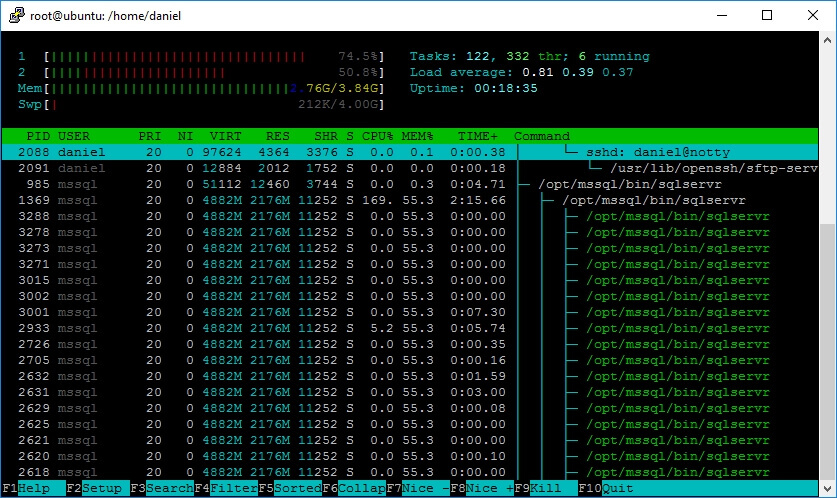
There is an alternative to top which is a Linux monitoring tool called htop (http://hisham.hm/htop/). The advantage of this tool is that it uses color and shows information about CPU, Memory and Swap as graphic bars.
If you are using Ubuntu, the following command will install htop.
sudo apt-get install htop

No comments:
Post a Comment