Linux: Find Out What Process Are Using Swap Space
The top and free command display the total amount of free and used physical and swap memory in the server. How do I determine which process is using swap space under Linux operating systems? How do I find out swap space usage of particular process such as memcached?You can use the any one of the following techniques but keep in mind that because of shared pages, there is no reliable way to get this information
[a] /proc/meminfo - This file reports statistics about memory usage on the system. It is used by free to report the amount of free and used memory (both physical and swap) on the system as well as the shared memory and buffers used by the kernel. You can also use free, vmstat and other tools to find out the same information.
[b] /proc/${PID}/smaps, /proc/${PID}/status, and /proc/${PID}/stat : Use these files to find information about memory, pages and swap used by each process using its PID.
[c] smem - This command (python script) reports memory usage with shared memory divided proportionally.
Finding out process ID and swap usage
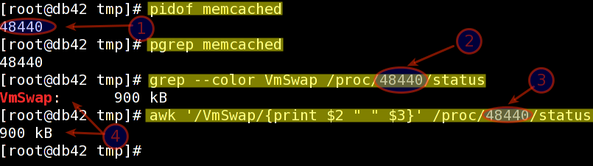
Type the following pidof command to find the process ID of a running program called memcached:
Alternatively, use pgrep command to lookup process PID, enter:
Sample outputs (note down PID number #1):
# pidof memcachedAlternatively, use pgrep command to lookup process PID, enter:
# pgrep memcachedSample outputs (note down PID number #1):
48440
To see swap space used by memcached (PID # 48440), enter (number #2):
Sample outputs (number #4):
# grep --color VmSwap /proc/48440/statusSample outputs (number #4):
VmSwap: 900 kB
Or the following awk command (number #3):
Sample outputs (number #4):
# awk '/VmSwap/{print $2 " " $3}' /proc/48440/statusSample outputs (number #4):
Fig.01: Finding out memcached process swap usage
Listing all process swap space usage
Type the following bash for loop command to see swap space usage per process:
for file in /proc/*/status ; do awk '/VmSwap|Name/{printf $2 " " $3}END{ print ""}' $file; done
Type the following command to sort out output:
for file in /proc/*/status ; do awk '/VmSwap|Name/{printf $2 " " $3}END{ print ""}' $file; done | sort -k 2 -n -r | less
Sample outputs:
php-cgi 11964 kB
php-cgi 11016 kB
php-cgi 10392 kB
php-cgi 10336 kB
php-cgi 9844 kB
php-cgi 9780 kB
php-cgi 8584 kB
php-cgi 7996 kB
php-cgi 7960 kB
php-cgi 7956 kB
php-cgi 7796 kB
php-cgi 7540 kB
php-cgi 6884 kB
squid 6864 kB
php-cgi 6640 kB
php-cgi 6556 kB
php-cgi 5848 kB
php-cgi 5744 kB
php-cgi 5636 kB
php-cgi 5592 kB
php-cgi 5488 kB
php-cgi 5132 kB
php-cgi 4584 kB
php-cgi 4508 kB
php-cgi 4388 kB
lighttpd 4100 kB
php-cgi 3984 kB
php-cgi 3644 kB
php-cgi 3616 kB
php-cgi 3604 kB
rpc.mountd 3580 kB
....
..
Say hello to smem
The smem command reports physical memory usage, taking shared memory pages into account. Unshared memory is reported as the USS (Unique Set Size). Shared memory is divided evenly among the processes sharing that memory. The unshared memory (USS) plus a process's proportion of shared memory is reported as the PSS (Proportional Set Size). The USS and PSS only include physical memory usage. They do not include memory that has been swapped out to disk. Memory can be reported by process, by user, by mapping, or system-wide. Both text mode and graphical output are available.
Installation
To install smem[2] type the following command under Debian / Ubuntu Linux:
RHEL / CentOS Linux user type the following command:
$ sudo apt-get install smemRHEL / CentOS Linux user type the following command:
$ wget http://www.selenic.com/smem/download/smem-1.2.tar.gz
$ tar xvf smem-1.2.tar.gz
# cp /tmp/smem-1.2/smem /usr/local/bin/
# chmod +x /usr/local/bin/smem
How do I use smem command?
The syntax is:
smem [option]
## This lets smem include the size of the kernel's code and statically allocated data in the systemwide (-w) output ##
smem -K /path/to/kernel/image/on/disk [option]
## Amount of physical RAM.  This lets smem detect the amount of memory used by firmware/hardware in the systemwide (-w) output.
## If  provided, it will also be used as the total memory size to base percentages on.
smem -R REALMEMSIZE [option]
To see basic process information, enter:
Sample outputs:
# smemSample outputs:
  PID User     Command                         Swap      USS      PSS      RSS
53369 xxxxxxx  /usr/bin/php-cgi                2788        0        0        8
53387 xxxxxxx  /usr/bin/php-cgi                2796        0        0        8
36227 xxxxxxx  /usr/bin/php-cgi                2324        0        1        8
36232 xxxxxxx  /usr/bin/php-cgi                2324        0        1        4
36233 xxxxxxx  /usr/bin/php-cgi                2324        0        1        4
46733 xxxxxxx  /usr/bin/php-cgi                2904        0        2        8
46739 xxxxxxxx /usr/bin/php-cgi                2904        0        2        4
 3623 root     ssh-agent                        576        4        4        4
53378 xxxxxxx  /usr/bin/php-cgi                2788        4        4        8
53396 vivek    /usr/bin/php-cgi                2788        4        4        8
 7855 root     rpc.rquotad                      144        4        6      116
 7480 root     ssh-agent                        604        4        7      112
34832 root     ssh-agent                        576        4        7       92
 7334 root     /sbin/mingetty /dev/tty1          76        4       19      436
 7336 root     /sbin/mingetty /dev/tty2          76        4       19      436
 7338 root     /sbin/mingetty /dev/tty3          76        4       19      436
 7340 root     /sbin/mingetty /dev/tty4          80        4       19      436
 7346 root     /sbin/mingetty /dev/tty5          80        4       19      436
 7350 root     /sbin/mingetty /dev/tty6          76        4       19      436
 7332 root     /sbin/agetty /dev/ttyS1 192       80        4       22      460
53405 raj      /usr/bin/php-cgi                2760       32       32       36
 7780 rpcuser  rpc.statd                       3568        4       41      668
To see library-oriented view, enter:
To see user-oriented view, enter:
Sample outputs:
# smem -mTo see user-oriented view, enter:
# smem -uSample outputs:
User     Count     Swap      USS      PSS      RSS
rpcuser      1     3568        4       41      668
vivek        4     7300       44       73      564
xxxxxxxx     3     6120       56       77      524
rpc          1      200       68      104      596
raj          1      468      272      300      892
ntp          1      316      324      367     1036
cdnnginx     1      420      572      603     1216
To see systemwide memory usage summary pass the -w option:
Sample outputs:
# smem -wSample outputs:
Area                           Used      Cache   Noncache
firmware/hardware                 0          0          0
kernel image                      0          0          0
kernel dynamic memory       5302144    5137920     164224
userspace memory            2692196     240828    2451368
free memory                  126228     126228          0
To see system view
To see totals and percentages, enter:
Sample outputs:
# smem -R 8G -K /path/to/vmlinux/on/disk -wTo see totals and percentages, enter:
# smem -t -pSample outputs:
  PID User     Command                         Swap      USS      PSS      RSS
53369 xxxxxxx  /usr/bin/php-cgi               0.04%    0.00%    0.00%    0.00%
53387 xxxxxxx  /usr/bin/php-cgi               0.04%    0.00%    0.00%    0.00%
36227 xxxxxxx  /usr/bin/php-cgi               0.04%    0.00%    0.00%    0.00%
36232 xxxxxxx  /usr/bin/php-cgi               0.04%    0.00%    0.00%    0.00%
36233 xxxxxxx  /usr/bin/php-cgi               0.04%    0.00%    0.00%    0.00%
46733 xxxxxxxy /usr/bin/php-cgi               0.05%    0.00%    0.00%    0.00%
46739 xxxxxxxy /usr/bin/php-cgi               0.05%    0.00%    0.00%    0.00%
 3623 root     ssh-agent                      0.01%    0.00%    0.00%    0.00%
53378 xxxxxxx  /usr/bin/php-cgi               0.04%    0.00%    0.00%    0.00%
53396 xxxxxxx  /usr/bin/php-cgi               0.04%    0.00%    0.00%    0.00%
 7855 root     rpc.rquotad                    0.00%    0.00%    0.00%    0.00%
 7480 root     ssh-agent                      0.01%    0.00%    0.00%    0.00%
34832 root     ssh-agent                      0.01%    0.00%    0.00%    0.00%
 7334 root     /sbin/mingetty /dev/tty1       0.00%    0.00%    0.00%    0.00%
 7336 root     /sbin/mingetty /dev/tty2       0.00%    0.00%    0.00%    0.00%
 7338 root     /sbin/mingetty /dev/tty3       0.00%    0.00%    0.00%    0.00%
.....
..
...
65304 vivek    /usr/bin/php-cgi               0.00%    0.16%    0.27%    0.61%
33931 vivek    /usr/bin/php-cgi               0.00%    0.14%    0.28%    0.44%
47933 squid    (squid) -f /etc/squid/squid    0.11%    2.69%    2.69%    2.71%
28410 mysql    /usr/libexec/mysqld --based    0.01%    3.67%    3.67%    3.68%
48440 memcached memcached -d -p 11211 -u me    0.01%    4.41%    4.41%    4.41%
-------------------------------------------------------------------------------
  191 24                                      5.36%   16.08%   19.43%   27.24%
Options
Type the following command to see all other supported options:
Sample outputs:
# smem --helpSample outputs:
  -h, --help            show this help message and exit
  -H, --no-header       disable header line
  -c COLUMNS, --columns=COLUMNS
                        columns to show
  -t, --totals          show totals
  -R REALMEM, --realmem=REALMEM
                        amount of physical RAM
  -K KERNEL, --kernel=KERNEL
                        path to kernel image
  -m, --mappings        show mappings
  -u, --users           show users
  -w, --system          show whole system
  -P PROCESSFILTER, --processfilter=PROCESSFILTER
                        process filter regex
  -M MAPFILTER, --mapfilter=MAPFILTER
                        map filter regex
  -U USERFILTER, --userfilter=USERFILTER
                        user filter regex
  -n, --numeric         numeric output
  -s SORT, --sort=SORT  field to sort on
  -r, --reverse         reverse sort
  -p, --percent         show percentage
  -k, --abbreviate      show unit suffixes
  --pie=PIE             show pie graph
  --bar=BAR             show bar graph
  -S SOURCE, --source=SOURCE
                        /proc data source
A note about top command
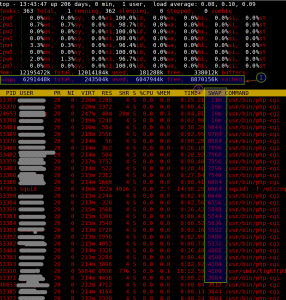
Type the top command as root:
To sort process as per swap page usage (SWAP = VIRT - RES) type capital O (option) followed by p (small p) and [Enter] key:
# topTo sort process as per swap page usage (SWAP = VIRT - RES) type capital O (option) followed by p (small p) and [Enter] key:
Fig.02 top command - process sorted by swap usage (click to enlarge)
References:
- ^ From the htop faq page:It is not possible to get the exact size of used swap space of a process. The top command fakes this information by making SWAP = VIRT - RES, but that is not a good metric, because other stuff such as video memory counts on VIRT as well (for example: top says my X process is using 81M of swap, but it also reports my system as a whole is using only 2M of swap. Therefore, I will not add a similar Swap column to htop because I don't know a reliable way to get this information (actually, I don't think it's possible to get an exact number, because of shared pages).
- ^ smem memory reporting tool can be downloaded by visiting this page.
- man pages: top, free, htop, vmstat, smem, and proc(5)


No comments:
Post a Comment