Find: Ram Size in Linux
How do I find out my RAM size under Linux operating systems?
You can use the following commands to find out actual RAM size under Linux operating systems:
/proc/meminfo file
Sample outputs:
The /proc/meminfo file tells you about memory usage on the server. This file is used by free and many other commands to display the amount of free and used memory (both physical and swap) on the system as well as the shared memory and buffers used by the kernel. Type the following command to view total installed ram and used ram, enter:
OR
Sample outputs:
$ less /proc/meminfoOR
$ cat /proc/meminfoSample outputs:
MemTotal:      8177444 kB
MemFree:       1528304 kB
Buffers:        353152 kB
Cached:        2301132 kB
SwapCached:          0 kB
Active:        5250532 kB
Inactive:       983832 kB
HighTotal:           0 kB
HighFree:            0 kB
LowTotal:      8177444 kB
LowFree:       1528304 kB
SwapTotal:     1052248 kB
SwapFree:      1052248 kB
Dirty:            1796 kB
Writeback:           0 kB
AnonPages:     3579784 kB
Mapped:         106548 kB
Slab:           295500 kB
PageTables:      82956 kB
NFS_Unstable:        0 kB
Bounce:              0 kB
CommitLimit:   5140968 kB
Committed_AS:  4959796 kB
VmallocTotal: 34359738367 kB
VmallocUsed:    263900 kB
VmallocChunk: 34359473347 kB
HugePages_Total:     0
HugePages_Free:      0
HugePages_Rsvd:      0
Hugepagesize:     2048 kB
free Command
Free command is frontend to /proc/meminfo file. It provide more human readable output to show you the total amount of free and used physical and swap memory in the system, as well as the buffers used by the kernel:
OR
Sample outputs:
$ free -mOR
$ free -gSample outputs:
             total       used       free     shared    buffers     cached
Mem:          7985       6466       1519          0        344       2249
-/+ buffers/cache:       3871       4114
Swap:         1027          0       1027
free command options
From the free(1) man page:
       The -b switch displays the amount of memory in bytes; the -k switch (set by default) displays it in kilobytes; the -m switch displays it in megabytes.

       The -t switch displays a line containing the totals.

       The -o switch disables the display of a "buffer adjusted" line.  If the -o option is not specified, free subtracts buffer memory from the used memory and adds it to the free memory reported.

       The -s switch activates continuous polling delay seconds apart. You may actually specify any floating point number for delay, usleep(3) is used for microsecond resolution delay times.
vmstat command
The vmstat command can display memory statistics including additional information about processes, paging, block IO, traps, and cpu activity. Type the following command:
Sample outputs:
$ vmstat -sSample outputs:
      8177444  total memory
      6655064  used memory
      5251360  active memory
       989748  inactive memory
      1522380  free memory
       353316  buffer memory
      2308588  swap cache
      1052248  total swap
            0  used swap
      1052248  free swap
     38412570 non-nice user cpu ticks
       100117 nice user cpu ticks
      5153239 system cpu ticks
    271927635 idle cpu ticks
        45717 IO-wait cpu ticks
        63003 IRQ cpu ticks
       564561 softirq cpu ticks
            0 stolen cpu ticks
      1846153 pages paged in
    158053429 pages paged out
            0 pages swapped in
            0 pages swapped out
   1226003322 interrupts
    740976858 CPU context switches
   1295805340 boot time
       659452 forks
top Command
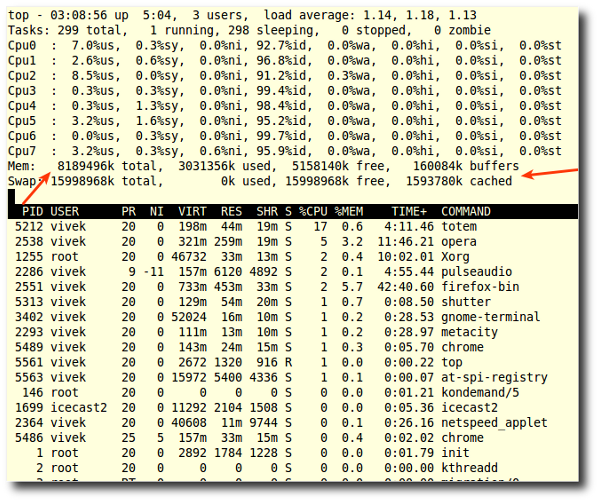
The top command provides a dynamic real-time view of a running system including a quick summary information about RAM, CPU as well as a list of tasks currently being managed by the Linux kernel. Type the following command:
Sample outputs:
$ topSample outputs:
I also suggest that you either use htop command or atop command to get detailed information on process and memory usage.
GUI System Information Tool
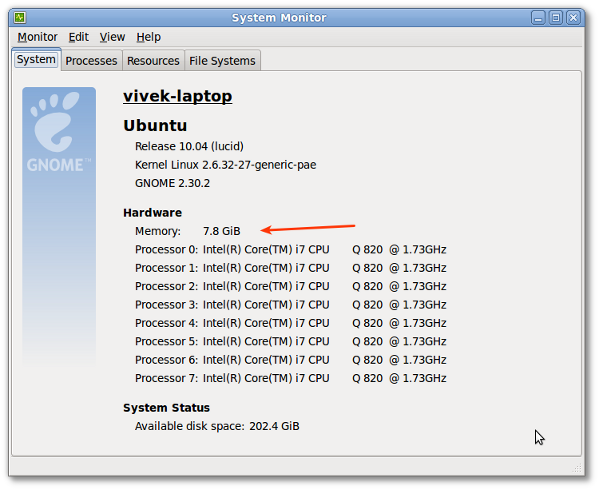
The System Monitor Gnome application enables you to display basic system information and monitor system processes, usage of system resources, and file systems. You can start System Monitor in the following ways:
Click on System menu > Choose Administration > System Monitor
Click on System menu > Choose Administration > System Monitor
Or type the following command:
$ gnome-system-monitorSample outputs:
dmidecode Command
The dmidecode command is used for dumping a computer's DMI (some say SMBIOS) table contents in a human-readable format. This table contains a description of the system's hardware components, as well as other useful pieces of information such as serial numbers and BIOS revision. Thanks to this table, you can retrieve this information without having to probe for the actual hardware. To see complete information about memory, enter:
Sample outputs:
$ sudo dmidecode --type memorySample outputs:
# dmidecode 2.9 SMBIOS 2.6 present. Handle 0x1000, DMI type 16, 15 bytes Physical Memory Array Location: System Board Or Motherboard Use: System Memory Error Correction Type: None Maximum Capacity: 16 GB Error Information Handle: Not Provided Number Of Devices: 4 Handle 0x1100, DMI type 17, 28 bytes Memory Device Array Handle: 0x1000 Error Information Handle: Not Provided Total Width: 64 bits Data Width: 64 bits Size: 4096 MB Form Factor: DIMM Set: None Locator: DIMM_A Bank Locator: Not Specified Type:Type Detail: Synchronous Speed: 1333 MHz (0.8 ns) Manufacturer: 80CE000080CE Serial Number: 45AAFB60 Asset Tag: 01101800 Part Number: M471B5273CH0-CH9 Handle 0x1101, DMI type 17, 28 bytes Memory Device Array Handle: 0x1000 Error Information Handle: Not Provided Total Width: 64 bits Data Width: 64 bits Size: 4096 MB Form Factor: DIMM Set: None Locator: DIMM_B Bank Locator: Not Specified Type: Type Detail: Synchronous Speed: 1333 MHz (0.8 ns) Manufacturer: 80CE000080CE Serial Number: 45AAFDAD Asset Tag: 01101800 Part Number: M471B5273CH0-CH9 Handle 0x1102, DMI type 17, 28 bytes Memory Device Array Handle: 0x1000 Error Information Handle: Not Provided Total Width: 64 bits Data Width: 64 bits Size: No Module Installed Form Factor: DIMM Set: None Locator: DIMM_C Bank Locator: Not Specified Type: Type Detail: Synchronous Speed: Unknown Manufacturer: Serial Number: Asset Tag: Part Number: Handle 0x1103, DMI type 17, 28 bytes Memory Device Array Handle: 0x1000 Error Information Handle: Not Provided Total Width: 64 bits Data Width: 64 bits Size: No Module Installed Form Factor: DIMM Set: None Locator: DIMM_D Bank Locator: Not Specified Type: Type Detail: Synchronous Speed: Unknown Manufacturer: Serial Number: Asset Tag: Part Number:


No comments:
Post a Comment