Friday, November 20, 2015

Password aging policies in HP-UX

Password aging policies in HP-UX


# /usr/lbin/getprpw test
uid=101, bootpw=NO, audid=13, audflg=1, mintm=2, maxpwln=-1, exptm=30, lftm=40,
spwchg=Thu Nov 21 18:07:34 2002, upwchg=-1, acctexp=-1, llog=-1, expwarn=2, usrp
ick=DFT, syspnpw=DFT, rstrpw=DFT, nullpw=DFT, admnum=-1, syschpw=DFT, sysltpw=DF
T, timeod=-1, slogint=Thu Nov 21 16:08:10 2002, ulogint=Thu Nov 21 16:07:13 2002
, sloginy=-1, culogin=-1, uloginy=-1, umaxlntr=-1, alock=NO, lockout=0000100


Password Format Policies:

maxpwln ==> Maximum Password Length
nullpw ==> Allow Null Passwords
rstrpw ==> Use Restriction Rules
usrpick ==> User Specifies
syschpw ==> System Generates Character
sysltpw ==> System Generates Letters only
syspnpw ==> System Generates Pronounceable

Password Aging Policies

exptm ==> Password Expiration Time (days)
expwarn ==> Password Expiration Warning Time (days)
lftm ==> Password Life Time (days)
mintm ==> Time Between Password Changes (days)

NOTE: If password aging is disabled, all above parameters are set
to 0.

General User Account Policies

bootpw ==> Require Login Upon Boot To Single-User State
llog ==> Maximum Inactive Time (days)
umaxlntr ==> Unsuccessful login Tries Allowed

NOTE: If Lock Inactive Accounts is disabled, llog is set to 0.

Terminal Security Policies

dlylntr ==> Delay Between Login Tries (sec)
lntmout ==> Login Timeout Value (sec)

Tuesday, November 17, 2015

2. Why is swap being used even though I have plenty of free RAM?

2. Why is swap being used even though I have plenty of free RAM?


Setting the swappiness value doesn't work in every situation. If it works for you, great. If not, I've written a script to periodically clear out swap by turning it off and back on again.
Toggling swap is a bit risky if you're not careful. If you don't have enough free RAM to hold everything in RAM plus everything in swap, trying to disable swap will cause your system to become unresponsive. My script first checks whether there's enough free RAM (which takes a bit of doing, as the actual amount of free RAM is different from what free reports as free), then only toggles swap if so. But, if you're a bit short on RAM, don't start another major process while the script is running. Here it is:
#!/bin/bash

# Make sure that all text is parsed in the same language
export LC_MESSAGES=en_US.UTF-8
export LC_COLLATE=en_US.UTF-8
export LANG=en_US.utf8
export LANGUAGE=en_US:en
export LC_CTYPE=en_US.UTF-8

# Calculate how much memory and swap is free
free_data="$(free)"
mem_data="$(echo "$free_data" | grep 'Mem:')"
free_mem="$(echo "$mem_data" | awk '{print $4}')"
buffers="$(echo "$mem_data" | awk '{print $6}')"
cache="$(echo "$mem_data" | awk '{print $7}')"
total_free=$((free_mem + buffers + cache))
used_swap="$(echo "$free_data" | grep 'Swap:' | awk '{print $3}')"

echo -e "Free memory:\t$total_free kB ($((total_free / 1024)) MB)\nUsed swap:\t$used_swap kB ($((used_swap / 1024)) MB)"

# Do the work
if [[ $used_swap -eq 0 ]]; then
    echo "Congratulations! No swap is in use."
elif [[ $used_swap -lt $total_free ]]; then
    echo "Freeing swap..."
    swapoff -a
    swapon -a
else
    echo "Not enough free memory. Exiting."
    exit 1
fi
You must run this script as root (e.g., with sudo). This script won't leave your system unresponsive; if you've got insufficient RAM, it will refuse to toggle swap. I've used this script without problems for close to five years now.

1. Why is swap being used even though I have plenty of free RAM?

1. Why is swap being used even though I have plenty of free RAM?


What is swappiness and how do I change it?

The swappiness parameter controls the tendency of the kernel to move processes out of physical memory and onto the swap disk. Because disks are much slower than RAM, this can lead to slower response times for system and applications if processes are too aggressively moved out of memory.
  1. swappiness can have a value of between 0 and 100
  2. swappiness=0 tells the kernel to avoid swapping processes out of physical memory for as long as possible
  3. swappiness=100 tells the kernel to aggressively swap processes out of physical memory and move them to swap cache
The default setting in Ubuntu is swappiness=60. Reducing the default value of swappiness will probably improve overall performance for a typical Ubuntu desktop installation. A value of swappiness=10 is recommended, but feel free to experiment. Note: Ubuntu server installations have different performance requirements to desktop systems, and the default value of 60 is likely more suitable.
To check the swappiness value
cat /proc/sys/vm/swappiness
To change the swappiness value A temporary change (lost on reboot) with a swappiness value of 10 can be made with
sudo sysctl vm.swappiness=10
To make a change permanent, edit the configuration file with your favorite editor:
gksudo gedit /etc/sysctl.conf
Search for vm.swappiness and change its value as desired. If vm.swappiness does not exist, add it to the end of the file like so:
vm.swappiness=10
Save the file and reboot.


Is this explanation about VSS/RSS/PSS/USS accurately?

Is this explanation about VSS/RSS/PSS/USS accurately?

I read an explanation about VSS/RSS/PSS/USS:
The aim of this post is to provide information that will assist in interpreting memory reports from various tools so the true memory usage for Linux processes and the system can be determined.
Android has a tool called procrank (/system/xbin/procrank), which lists out the memory usage of Linux processes in order from highest to lowest usage. The sizes reported per process are VSS, RSS, PSS, and USS.
For the sake of simplicity in this description, memory will be expressed in terms of pages, rather than bytes. Linux systems like ours manage memory in 4096 byte pages at the lowest level.
VSS (reported as VSZ from ps) is the total accessible address space of a process. This size also includes memory that may not be resident in RAM like mallocs that have been allocated but not written to. VSS is of very little use for determing real memory usage of a process.
RSS is the total memory actually held in RAM for a process. RSS can be misleading, because it reports the total all of the shared libraries that the process uses, even though a shared library is only loaded into memory once regardless of how many processes use it. RSS is not an accurate representation of the memory usage for a single process.
PSS differs from RSS in that it reports the proportional size of its shared libraries, i.e. if three processes all use a shared library that has 30 pages, that library will only contribute 10 pages to the PSS that is reported for each of the three processes. PSS is a very useful number because when the PSS for all processes in the system are summed together, that is a good representation for the total memory usage in the system. When a process is killed, the shared libraries that contributed to its PSS will be proportionally distributed to the PSS totals for the remaining processes still using that library. In this way PSS can be slightly misleading, because when a process is killed, PSS does not accurately represent the memory returned to the overall system.
USS is the total private memory for a process, i.e. that memory that is completely unique to that process. USS is an extremely useful number because it indicates the true incremental cost of running a particular process. When a process is killed, the USS is the total memory that is actually returned to the system. USS is the best number to watch when initially suspicious of memory leaks in a process.
For systems that have Python available, there is also a nice tool called smem that will report memory statistics including all of these categories.
# procrank
procrank
PID      Vss        Rss           Pss         Uss   cmdline
481   31536K   30936K   14337K    9956K  system_server
475   26128K   26128K   10046K    5992K  zygote
526   25108K   25108K    9225K    5384K  android.process.acore
523   22388K   22388K    7166K    3432K  com.android.phone
574   21632K   21632K    6109K    2468K  com.android.settings
521   20816K   20816K    6050K    2776K  jp.co.omronsoft.openwnn
474    3304K    3304K    1097K     624K   /system/bin/mediaserver
37     304K      304K     289K      288K  /sbin/adbd
29     720K      720K     261K      212K  /system/bin/rild
601     412K     412K     225K      216K  procrank
   1     204K     204K     185K      184K  /init
35     388K     388K     182K      172K  /system/bin/qemud
284     384K     384K     160K      148K  top
27     376K     376K     148K      136K  /system/bin/vold
261     332K     332K     123K     112K  logcat
33     396K     396K     105K       80K   /system/bin/keystore
32     316K     316K     100K       88K   /system/bin/installd
269     328K     328K      95K       72K  /system/bin/sh
26     280K     280K      93K       84K   /system/bin/servicemanager
45     304K     304K      91K       80K   /system/bin/qemu-props
34     324K     324K      91K       68K   /system/bin/sh
260     324K     324K      91K       68K   /system/bin/sh
600     324K     324K      91K      68K   /system/bin/sh
25     308K     308K      88K       68K   /system/bin/sh
28     232K     232K      67K       60K   /system/bin/debuggerd
#
But cannot find the original of this article, I want to know whether this explanation is accurately.

  • Vss = virtual set size
  • Rss = resident set size
  • Pss = proportional set size
  • Uss = unique set size

Linux: Find Out What Process Are Using Swap Space

Linux: Find Out What Process Are Using Swap Space


The top and free command display the total amount of free and used physical and swap memory in the server. How do I determine which process is using swap space under Linux operating systems? How do I find out swap space usage of particular process such as 
memcached?
You can use the any one of the following techniques but keep in mind that because of shared pages, there is no reliable way to get this information

[a/proc/meminfo - This file reports statistics about memory usage on the system. It is used by free to report the amount of free and used memory (both physical and swap) on the system as well as the shared memory and buffers used by the kernel. You can also use free, vmstat and other tools to find out the same information.
[b/proc/${PID}/smaps/proc/${PID}/status, and /proc/${PID}/stat : Use these files to find information about memory, pages and swap used by each process using its PID.
[csmem - This command (python script) reports memory usage with shared memory divided proportionally.

Finding out process ID and swap usage

Type the following pidof command to find the process ID of a running program called memcached:
# pidof memcached
Alternatively, use pgrep command to lookup process PID, enter:
# pgrep memcached
Sample outputs (note down PID number #1):
48440
To see swap space used by memcached (PID # 48440), enter (number #2):
grep --color VmSwap /proc/48440/status
Sample outputs (number #4):
VmSwap:      900 kB
Or the following awk command (number #3):
# awk '/VmSwap/{print $2 " " $3}' /proc/48440/status
Sample outputs (number #4):
Fig.01: Finding out memcached process swap usage

Listing all process swap space usage

Type the following bash for loop command to see swap space usage per process:
 
for file in /proc/*/status ; do awk '/VmSwap|Name/{printf $2 " " $3}END{ print ""}' $file; done
 
Type the following command to sort out output:
 
for file in /proc/*/status ; do awk '/VmSwap|Name/{printf $2 " " $3}END{ print ""}' $file; done | sort -k 2 -n -r | less
 
Sample outputs:
php-cgi 11964 kB
php-cgi 11016 kB
php-cgi 10392 kB
php-cgi 10336 kB
php-cgi 9844 kB
php-cgi 9780 kB
php-cgi 8584 kB
php-cgi 7996 kB
php-cgi 7960 kB
php-cgi 7956 kB
php-cgi 7796 kB
php-cgi 7540 kB
php-cgi 6884 kB
squid 6864 kB
php-cgi 6640 kB
php-cgi 6556 kB
php-cgi 5848 kB
php-cgi 5744 kB
php-cgi 5636 kB
php-cgi 5592 kB
php-cgi 5488 kB
php-cgi 5132 kB
php-cgi 4584 kB
php-cgi 4508 kB
php-cgi 4388 kB
lighttpd 4100 kB
php-cgi 3984 kB
php-cgi 3644 kB
php-cgi 3616 kB
php-cgi 3604 kB
rpc.mountd 3580 kB
....
..

Say hello to smem

The smem command reports physical memory usage, taking shared memory pages into account. Unshared memory is reported as the USS (Unique Set Size). Shared memory is divided evenly among the processes sharing that memory. The unshared memory (USS) plus a process's proportion of shared memory is reported as the PSS (Proportional Set Size). The USS and PSS only include physical memory usage. They do not include memory that has been swapped out to disk. Memory can be reported by process, by user, by mapping, or system-wide. Both text mode and graphical output are available.

Installation

To install smem[2] type the following command under Debian / Ubuntu Linux:
$ sudo apt-get install smem
RHEL / CentOS Linux user type the following command:
$ wget http://www.selenic.com/smem/download/smem-1.2.tar.gz
$ tar xvf smem-1.2.tar.gz
# cp /tmp/smem-1.2/smem /usr/local/bin/
# chmod +x /usr/local/bin/smem

How do I use smem command?

The syntax is:
smem [option]
## This lets smem include the size of the kernel's code and statically allocated data in the systemwide (-w) output ##
smem -K /path/to/kernel/image/on/disk [option]
## Amount of physical RAM.  This lets smem detect the amount of memory used by firmware/hardware in the systemwide (-w) output.
## If  provided, it will also be used as the total memory size to base percentages on.
smem -R REALMEMSIZE [option]
To see basic process information, enter:
# smem
Sample outputs:
  PID User     Command                         Swap      USS      PSS      RSS
53369 xxxxxxx  /usr/bin/php-cgi                2788        0        0        8
53387 xxxxxxx  /usr/bin/php-cgi                2796        0        0        8
36227 xxxxxxx  /usr/bin/php-cgi                2324        0        1        8
36232 xxxxxxx  /usr/bin/php-cgi                2324        0        1        4
36233 xxxxxxx  /usr/bin/php-cgi                2324        0        1        4
46733 xxxxxxx  /usr/bin/php-cgi                2904        0        2        8
46739 xxxxxxxx /usr/bin/php-cgi                2904        0        2        4
 3623 root     ssh-agent                        576        4        4        4
53378 xxxxxxx  /usr/bin/php-cgi                2788        4        4        8
53396 vivek    /usr/bin/php-cgi                2788        4        4        8
 7855 root     rpc.rquotad                      144        4        6      116
 7480 root     ssh-agent                        604        4        7      112
34832 root     ssh-agent                        576        4        7       92
 7334 root     /sbin/mingetty /dev/tty1          76        4       19      436
 7336 root     /sbin/mingetty /dev/tty2          76        4       19      436
 7338 root     /sbin/mingetty /dev/tty3          76        4       19      436
 7340 root     /sbin/mingetty /dev/tty4          80        4       19      436
 7346 root     /sbin/mingetty /dev/tty5          80        4       19      436
 7350 root     /sbin/mingetty /dev/tty6          76        4       19      436
 7332 root     /sbin/agetty /dev/ttyS1 192       80        4       22      460
53405 raj      /usr/bin/php-cgi                2760       32       32       36
 7780 rpcuser  rpc.statd                       3568        4       41      668
To see library-oriented view, enter:
# smem -m
To see user-oriented view, enter:
# smem -u
Sample outputs:
User     Count     Swap      USS      PSS      RSS
rpcuser      1     3568        4       41      668
vivek        4     7300       44       73      564
xxxxxxxx     3     6120       56       77      524
rpc          1      200       68      104      596
raj          1      468      272      300      892
ntp          1      316      324      367     1036
cdnnginx     1      420      572      603     1216
To see systemwide memory usage summary pass the -w option:
# smem -w
Sample outputs:
Area                           Used      Cache   Noncache
firmware/hardware                 0          0          0
kernel image                      0          0          0
kernel dynamic memory       5302144    5137920     164224
userspace memory            2692196     240828    2451368
free memory                  126228     126228          0
To see system view
# smem -R 8G -K /path/to/vmlinux/on/disk -w
To see totals and percentages, enter:
# smem -t -p
Sample outputs:
  PID User     Command                         Swap      USS      PSS      RSS
53369 xxxxxxx  /usr/bin/php-cgi               0.04%    0.00%    0.00%    0.00%
53387 xxxxxxx  /usr/bin/php-cgi               0.04%    0.00%    0.00%    0.00%
36227 xxxxxxx  /usr/bin/php-cgi               0.04%    0.00%    0.00%    0.00%
36232 xxxxxxx  /usr/bin/php-cgi               0.04%    0.00%    0.00%    0.00%
36233 xxxxxxx  /usr/bin/php-cgi               0.04%    0.00%    0.00%    0.00%
46733 xxxxxxxy /usr/bin/php-cgi               0.05%    0.00%    0.00%    0.00%
46739 xxxxxxxy /usr/bin/php-cgi               0.05%    0.00%    0.00%    0.00%
 3623 root     ssh-agent                      0.01%    0.00%    0.00%    0.00%
53378 xxxxxxx  /usr/bin/php-cgi               0.04%    0.00%    0.00%    0.00%
53396 xxxxxxx  /usr/bin/php-cgi               0.04%    0.00%    0.00%    0.00%
 7855 root     rpc.rquotad                    0.00%    0.00%    0.00%    0.00%
 7480 root     ssh-agent                      0.01%    0.00%    0.00%    0.00%
34832 root     ssh-agent                      0.01%    0.00%    0.00%    0.00%
 7334 root     /sbin/mingetty /dev/tty1       0.00%    0.00%    0.00%    0.00%
 7336 root     /sbin/mingetty /dev/tty2       0.00%    0.00%    0.00%    0.00%
 7338 root     /sbin/mingetty /dev/tty3       0.00%    0.00%    0.00%    0.00%
.....
..
...
65304 vivek    /usr/bin/php-cgi               0.00%    0.16%    0.27%    0.61%
33931 vivek    /usr/bin/php-cgi               0.00%    0.14%    0.28%    0.44%
47933 squid    (squid) -f /etc/squid/squid    0.11%    2.69%    2.69%    2.71%
28410 mysql    /usr/libexec/mysqld --based    0.01%    3.67%    3.67%    3.68%
48440 memcached memcached -d -p 11211 -u me    0.01%    4.41%    4.41%    4.41%
-------------------------------------------------------------------------------
  191 24                                      5.36%   16.08%   19.43%   27.24%

Options

Type the following command to see all other supported options:
# smem --help
Sample outputs:
  -h, --help            show this help message and exit
  -H, --no-header       disable header line
  -c COLUMNS, --columns=COLUMNS
                        columns to show
  -t, --totals          show totals
  -R REALMEM, --realmem=REALMEM
                        amount of physical RAM
  -K KERNEL, --kernel=KERNEL
                        path to kernel image
  -m, --mappings        show mappings
  -u, --users           show users
  -w, --system          show whole system
  -P PROCESSFILTER, --processfilter=PROCESSFILTER
                        process filter regex
  -M MAPFILTER, --mapfilter=MAPFILTER
                        map filter regex
  -U USERFILTER, --userfilter=USERFILTER
                        user filter regex
  -n, --numeric         numeric output
  -s SORT, --sort=SORT  field to sort on
  -r, --reverse         reverse sort
  -p, --percent         show percentage
  -k, --abbreviate      show unit suffixes
  --pie=PIE             show pie graph
  --bar=BAR             show bar graph
  -S SOURCE, --source=SOURCE
                        /proc data source

A note about top command

Type the top command as root:
# top
To sort process as per swap page usage (SWAP = VIRT - RES) type capital O (option) followed by p (small p) and [Enter] key:
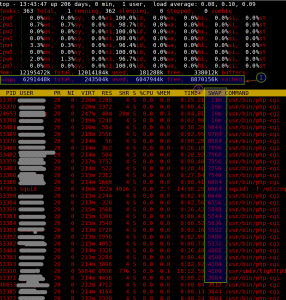
Fig.02 top command - sored process by swap usage
Fig.02 top command - process sorted by swap usage (click to enlarge)
References:
  1. ^ From the htop faq page:
    It is not possible to get the exact size of used swap space of a process. The top command fakes this information by making SWAP = VIRT - RES, but that is not a good metric, because other stuff such as video memory counts on VIRT as well (for example: top says my X process is using 81M of swap, but it also reports my system as a whole is using only 2M of swap. Therefore, I will not add a similar Swap column to htop because I don't know a reliable way to get this information (actually, I don't think it's possible to get an exact number, because of shared pages).
  2. ^ smem memory reporting tool can be downloaded by visiting this page.
  3. man pages: top, free, htop, vmstat, smem, and proc(5)

Find: Ram Size in Linux

Find: Ram Size in Linux

How do I find out my RAM size under Linux operating systems?

You can use the following commands to find out actual RAM size under Linux operating systems:

/proc/meminfo file
The /proc/meminfo file tells you about memory usage on the server. This file is used by free and many other commands to display the amount of free and used memory (both physical and swap) on the system as well as the shared memory and buffers used by the kernel. Type the following command to view total installed ram and used ram, enter:
$ less /proc/meminfo
OR
$ cat /proc/meminfo
Sample outputs:
MemTotal:      8177444 kB
MemFree:       1528304 kB
Buffers:        353152 kB
Cached:        2301132 kB
SwapCached:          0 kB
Active:        5250532 kB
Inactive:       983832 kB
HighTotal:           0 kB
HighFree:            0 kB
LowTotal:      8177444 kB
LowFree:       1528304 kB
SwapTotal:     1052248 kB
SwapFree:      1052248 kB
Dirty:            1796 kB
Writeback:           0 kB
AnonPages:     3579784 kB
Mapped:         106548 kB
Slab:           295500 kB
PageTables:      82956 kB
NFS_Unstable:        0 kB
Bounce:              0 kB
CommitLimit:   5140968 kB
Committed_AS:  4959796 kB
VmallocTotal: 34359738367 kB
VmallocUsed:    263900 kB
VmallocChunk: 34359473347 kB
HugePages_Total:     0
HugePages_Free:      0
HugePages_Rsvd:      0
Hugepagesize:     2048 kB

free Command

Free command is frontend to /proc/meminfo file. It provide more human readable output to show you the total amount of free and used physical and swap memory in the system, as well as the buffers used by the kernel:
$ free -m
OR
$ free -g
Sample outputs:
             total       used       free     shared    buffers     cached
Mem:          7985       6466       1519          0        344       2249
-/+ buffers/cache:       3871       4114
Swap:         1027          0       1027

free command options

From the free(1) man page:
 
       The -b switch displays the amount of memory in bytes; the -k switch (set by default) displays it in kilobytes; the -m switch displays it in megabytes.
 
       The -t switch displays a line containing the totals.
 
       The -o switch disables the display of a "buffer adjusted" line.  If the -o option is not specified, free subtracts buffer memory from the used memory and adds it to the free memory reported.
 
       The -s switch activates continuous polling delay seconds apart. You may actually specify any floating point number for delay, usleep(3) is used for microsecond resolution delay times.
 

vmstat command

The vmstat command can display memory statistics including additional information about processes, paging, block IO, traps, and cpu activity. Type the following command:
$ vmstat -s
Sample outputs:
      8177444  total memory
      6655064  used memory
      5251360  active memory
       989748  inactive memory
      1522380  free memory
       353316  buffer memory
      2308588  swap cache
      1052248  total swap
            0  used swap
      1052248  free swap
     38412570 non-nice user cpu ticks
       100117 nice user cpu ticks
      5153239 system cpu ticks
    271927635 idle cpu ticks
        45717 IO-wait cpu ticks
        63003 IRQ cpu ticks
       564561 softirq cpu ticks
            0 stolen cpu ticks
      1846153 pages paged in
    158053429 pages paged out
            0 pages swapped in
            0 pages swapped out
   1226003322 interrupts
    740976858 CPU context switches
   1295805340 boot time
       659452 forks

top Command

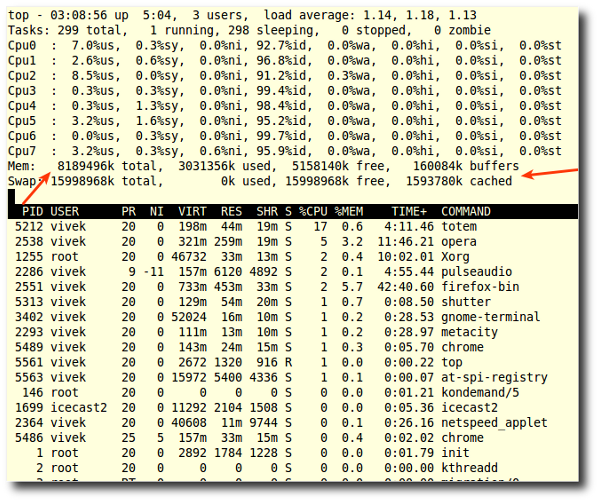
The top command provides a dynamic real-time view of a running system including a quick summary information about RAM, CPU as well as a list of tasks currently being managed by the Linux kernel. Type the following command:
$ top
Sample outputs:
Fig.01: Display Linux RAM Size with the top commad
I also suggest that you either use htop command or atop command to get detailed information on process and memory usage.

GUI System Information Tool

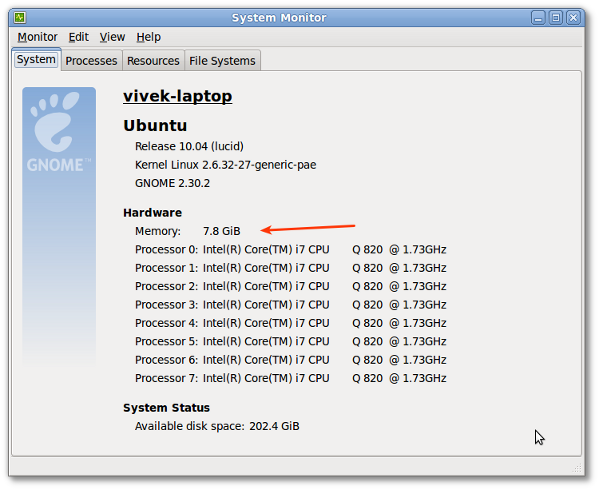
The System Monitor Gnome application enables you to display basic system information and monitor system processes, usage of system resources, and file systems. You can start System Monitor in the following ways:
Click on System menu > Choose Administration > System Monitor
Or type the following command:
$ gnome-system-monitor
Sample outputs:
Fig.02: Linux view installed memory with the System Monitor application

dmidecode Command

The dmidecode command is used for dumping a computer's DMI (some say SMBIOS) table contents in a human-readable format. This table contains a description of the system's hardware components, as well as other useful pieces of information such as serial numbers and BIOS revision. Thanks to this table, you can retrieve this information without having to probe for the actual hardware. To see complete information about memory, enter:
$ sudo dmidecode --type memory
Sample outputs:
# dmidecode 2.9
SMBIOS 2.6 present.
Handle 0x1000, DMI type 16, 15 bytes
Physical Memory Array
 Location: System Board Or Motherboard
 Use: System Memory
 Error Correction Type: None
 Maximum Capacity: 16 GB
 Error Information Handle: Not Provided
 Number Of Devices: 4
Handle 0x1100, DMI type 17, 28 bytes
Memory Device
 Array Handle: 0x1000
 Error Information Handle: Not Provided
 Total Width: 64 bits
 Data Width: 64 bits
 Size: 4096 MB
 Form Factor: DIMM
 Set: None
 Locator: DIMM_A
 Bank Locator: Not Specified
 Type: 
 Type Detail: Synchronous
 Speed: 1333 MHz (0.8 ns)
 Manufacturer: 80CE000080CE
 Serial Number: 45AAFB60
 Asset Tag: 01101800
 Part Number: M471B5273CH0-CH9
Handle 0x1101, DMI type 17, 28 bytes
Memory Device
 Array Handle: 0x1000
 Error Information Handle: Not Provided
 Total Width: 64 bits
 Data Width: 64 bits
 Size: 4096 MB
 Form Factor: DIMM
 Set: None
 Locator: DIMM_B
 Bank Locator: Not Specified
 Type: 
 Type Detail: Synchronous
 Speed: 1333 MHz (0.8 ns)
 Manufacturer: 80CE000080CE
 Serial Number: 45AAFDAD
 Asset Tag: 01101800
 Part Number: M471B5273CH0-CH9
Handle 0x1102, DMI type 17, 28 bytes
Memory Device
 Array Handle: 0x1000
 Error Information Handle: Not Provided
 Total Width: 64 bits
 Data Width: 64 bits
 Size: No Module Installed
 Form Factor: DIMM
 Set: None
 Locator: DIMM_C
 Bank Locator: Not Specified
 Type: 
 Type Detail: Synchronous
 Speed: Unknown
 Manufacturer:
 Serial Number:
 Asset Tag:
 Part Number:
Handle 0x1103, DMI type 17, 28 bytes
Memory Device
 Array Handle: 0x1000
 Error Information Handle: Not Provided
 Total Width: 64 bits
 Data Width: 64 bits
 Size: No Module Installed
 Form Factor: DIMM
 Set: None
 Locator: DIMM_D
 Bank Locator: Not Specified
 Type: 
 Type Detail: Synchronous
 Speed: Unknown
 Manufacturer:
 Serial Number:
 Asset Tag:
 Part Number:

  How to Change Instance Type & Security Group of EC2 in AWS By David Taylor Updated April 29, 2023 EC2 stands for Elastic Compute Cloud...